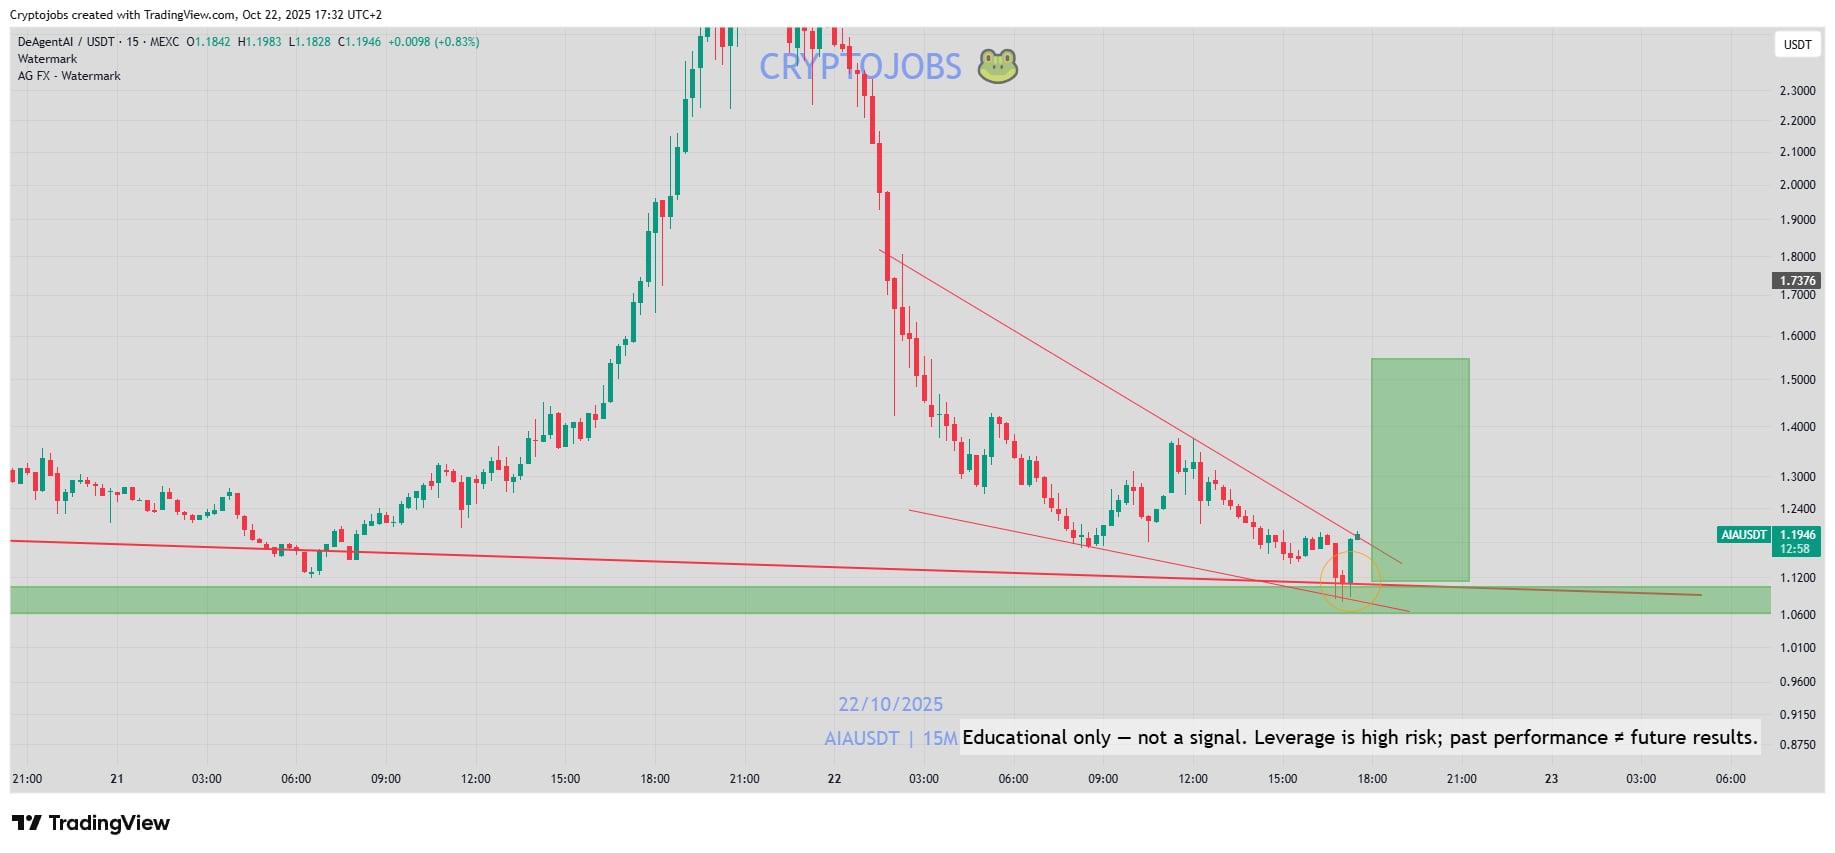
Before
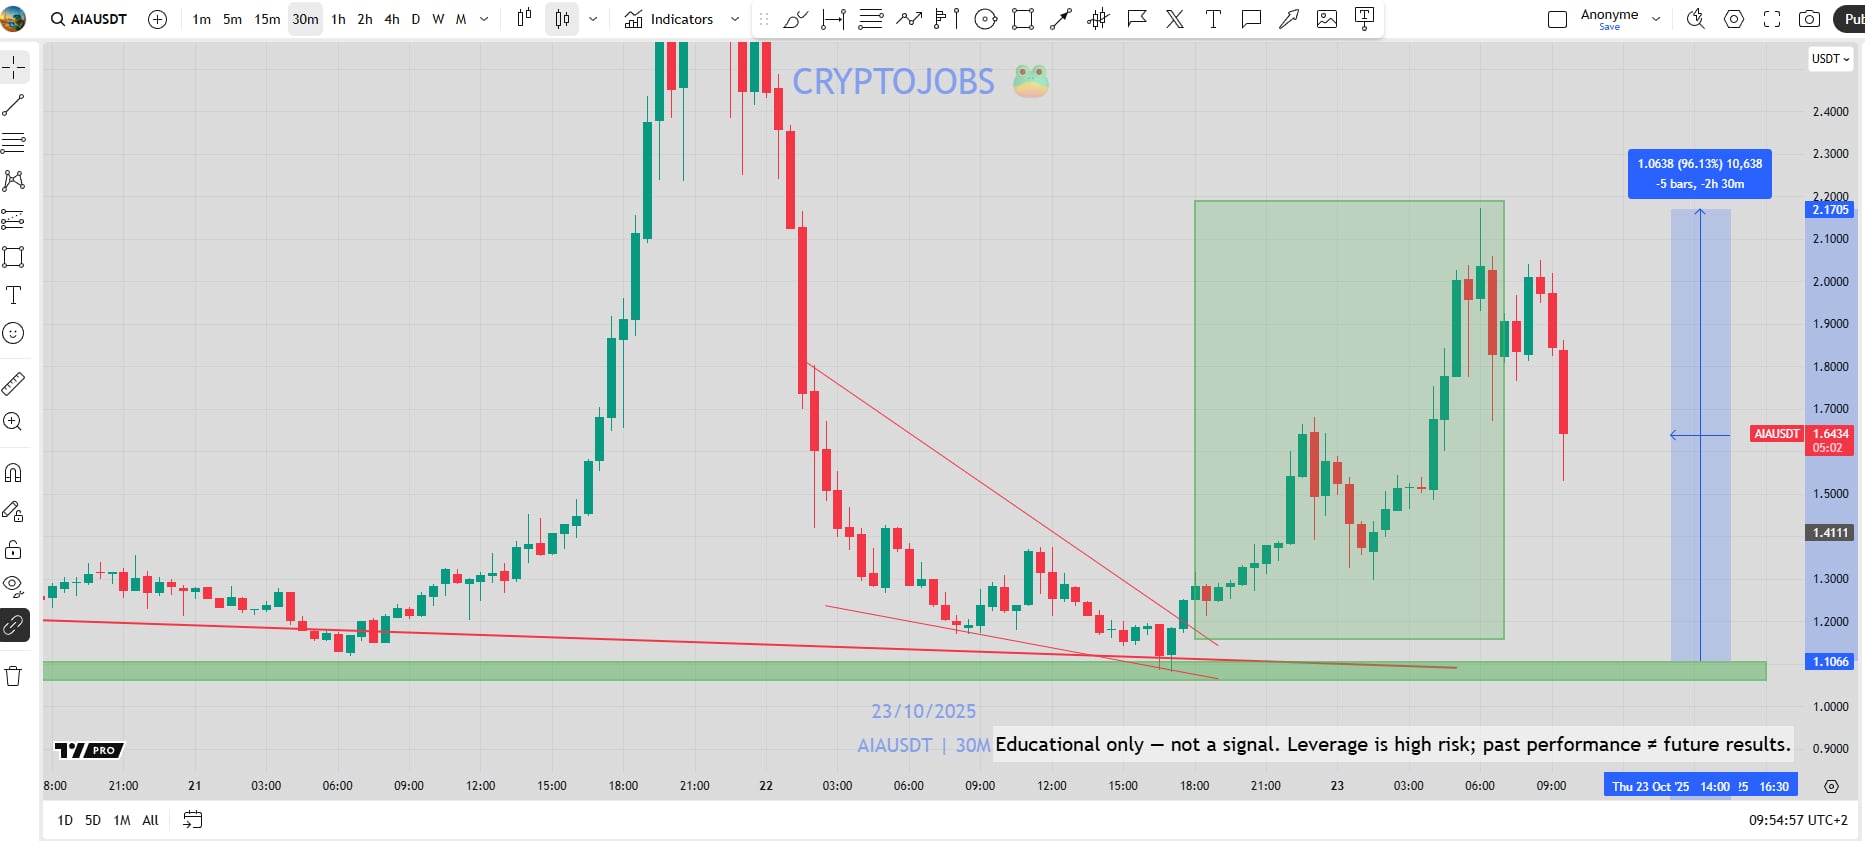
On October 22, 2025, AIA had pulled back into the 1.06 to 1.12 demand zone on the 15m chart, inside a falling wedge. I marked a long setup from that zone.
After
On October 23, 2025, AIA broke out of the wedge and rallied to about 2.17.
Result
About +96% from the 1.1066 demand zone to the 2.1705 high, on the visible chart. NFA.
Original post: See the CMC post