Before
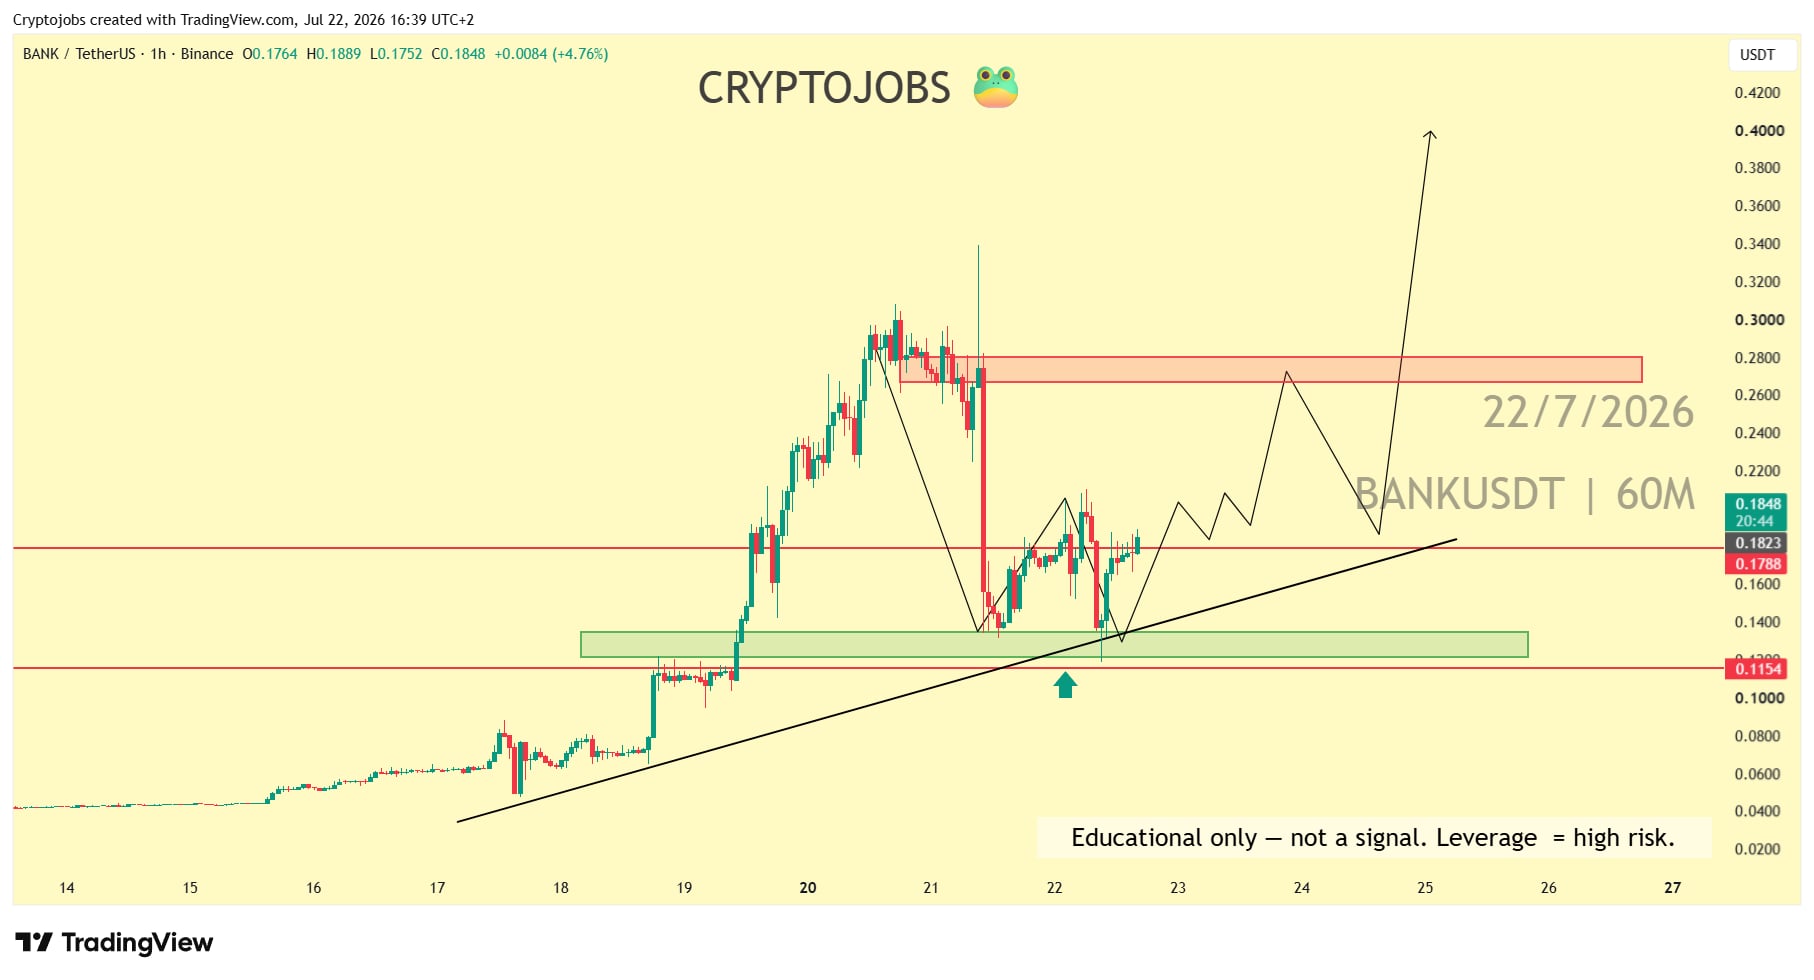
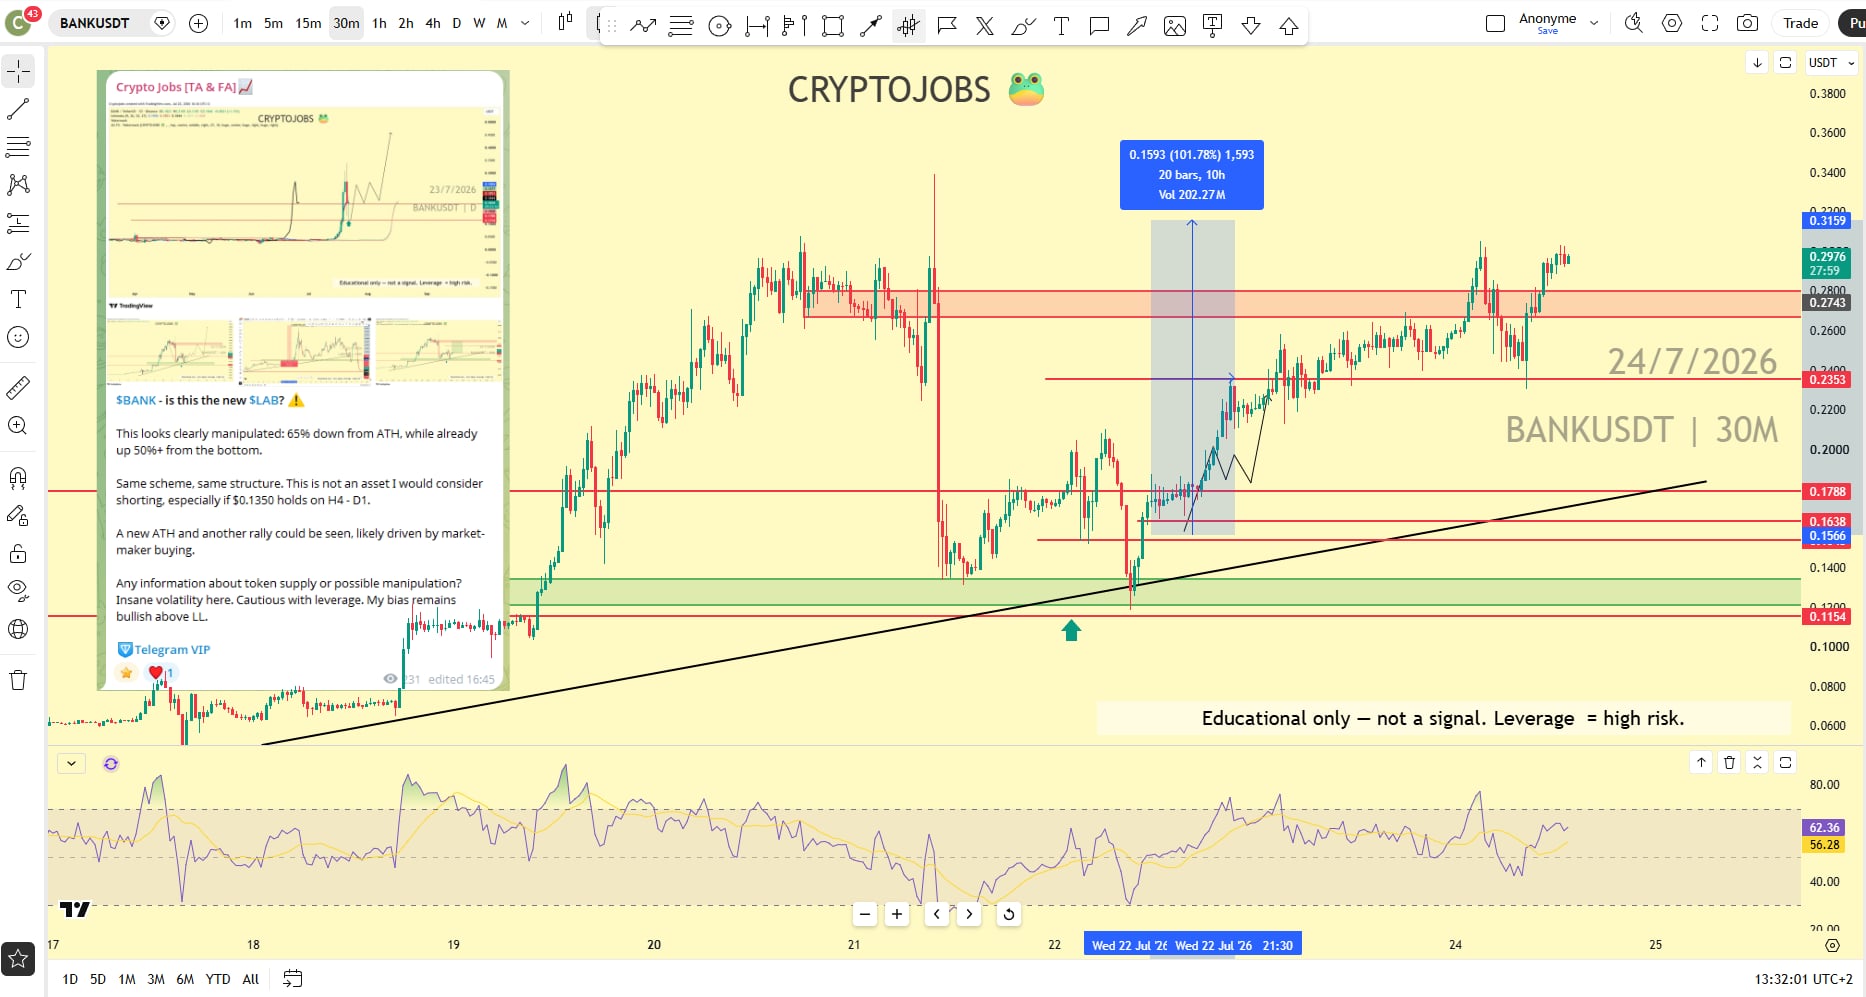
On July 22, 2026, BANK was holding the green demand zone above 0.1154 on the 1h chart, with a rising trendline as support. I marked the long setup from that zone, with the 0.27 to 0.28 area as resistance to clear.
After
On July 24, 2026, BANK pushed through the 0.2743 resistance and ran up to about 0.3159.
Result
About +100% from the 0.1566 zone to the 0.3159 high, on the visible chart. NFA.
Original post: See the CMC post