Before
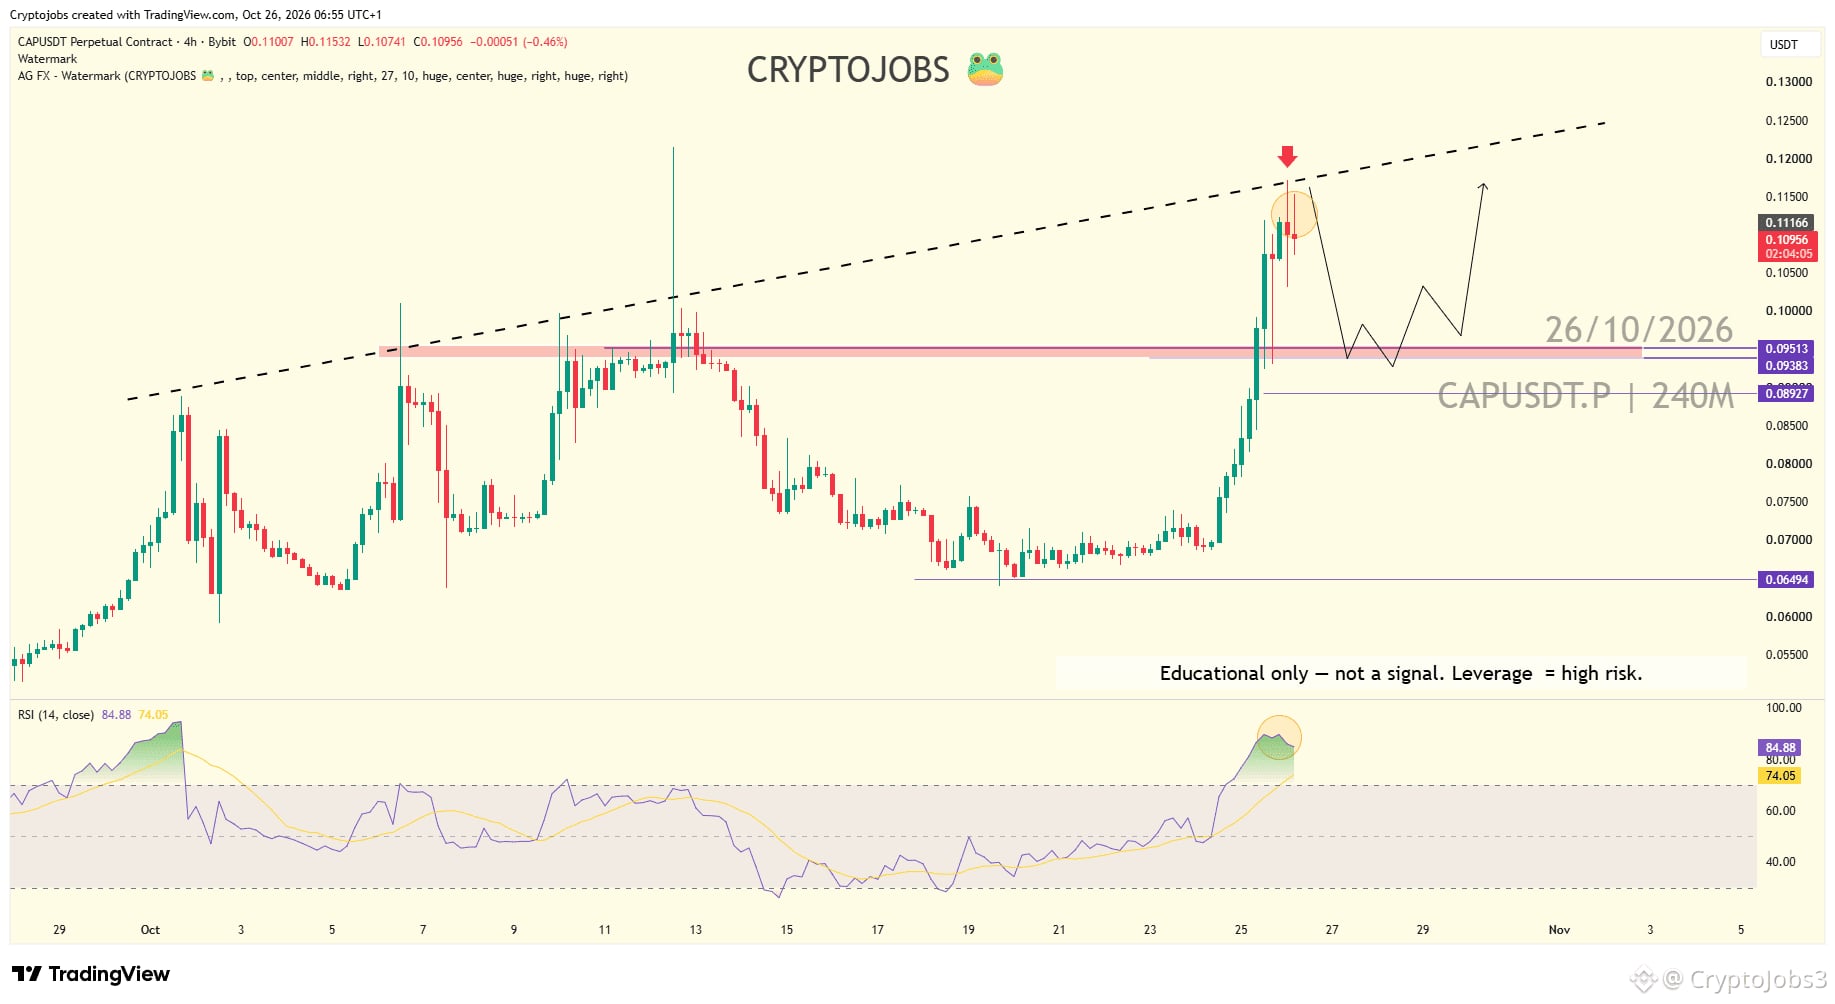
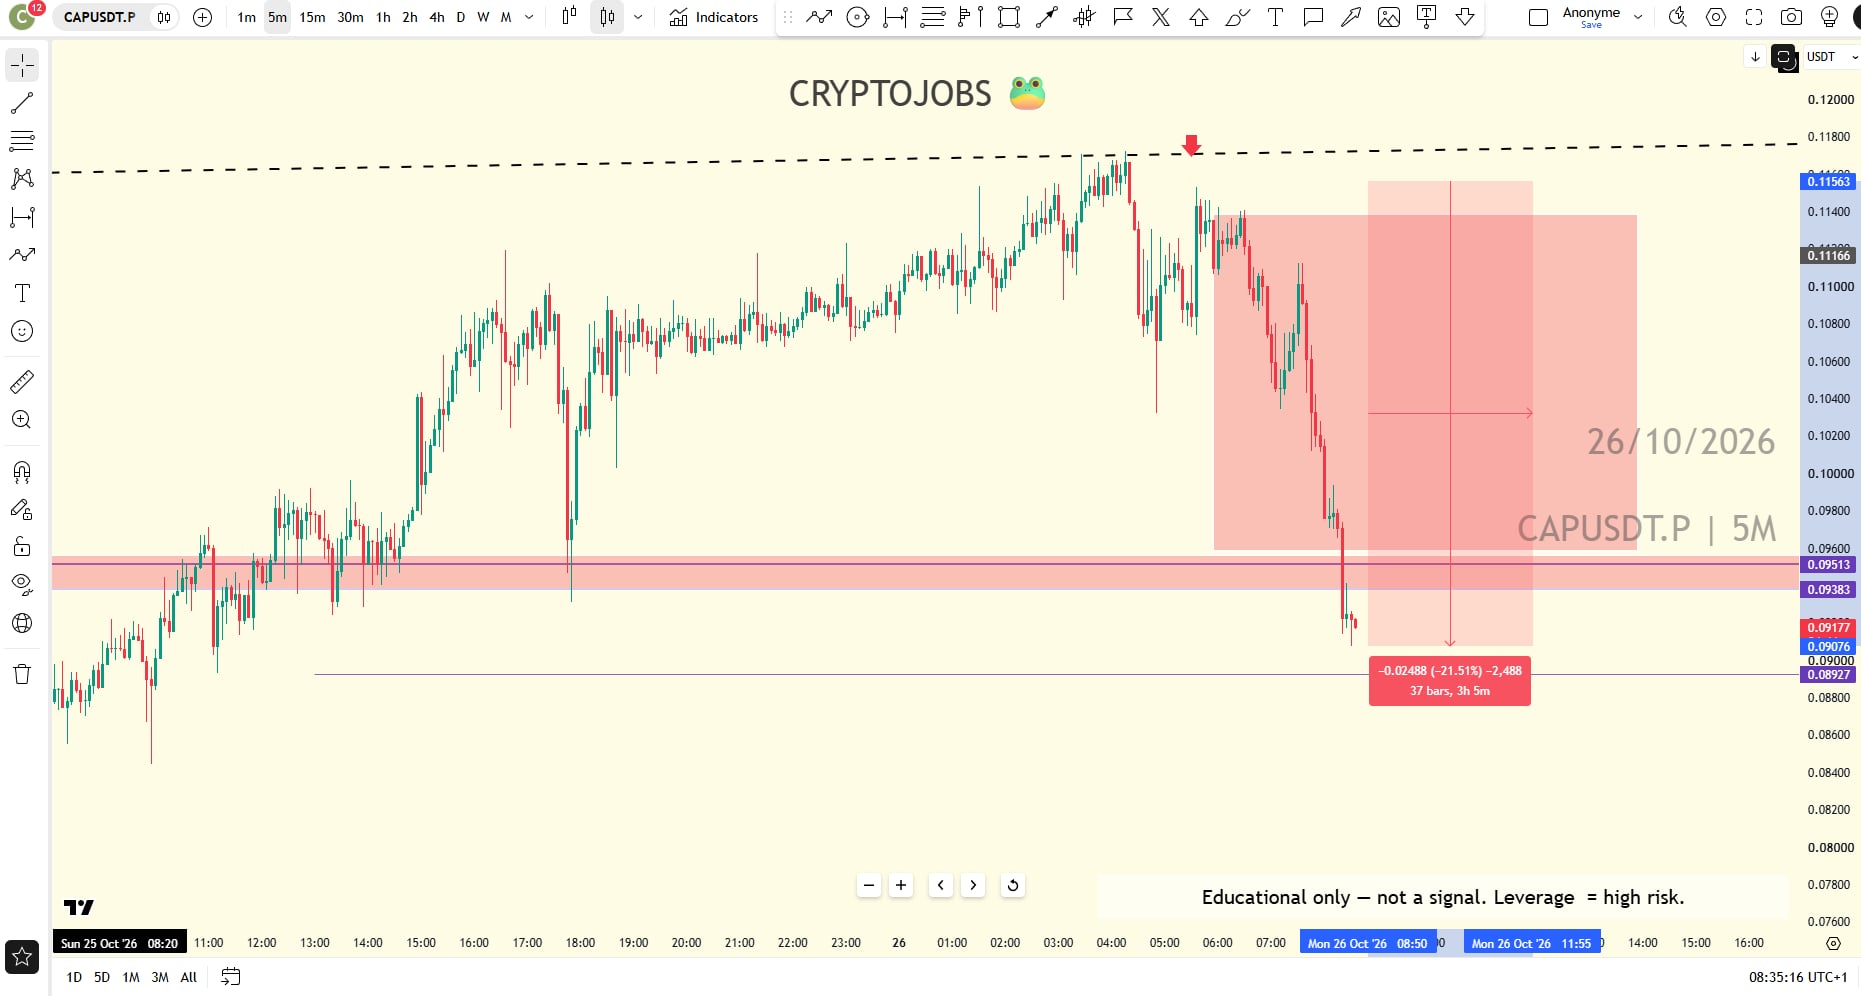
$CAP on the 4H chart, 26 Oct 2026. Price pumped vertically into the long rising trendline from early October, around 0.1116, with RSI at 84, deep in overbought territory. The 0.0951 - 0.0938 zone sat below as the nearest demand area.
After
Price got rejected at the trendline and dropped to about 0.0918 on 26 Oct 2026, back into the demand zone in 3h 05m.
Result
- Move: about -21.5% on price
- Time: about 3 hours
- Chart study only. Educational only, NFA.