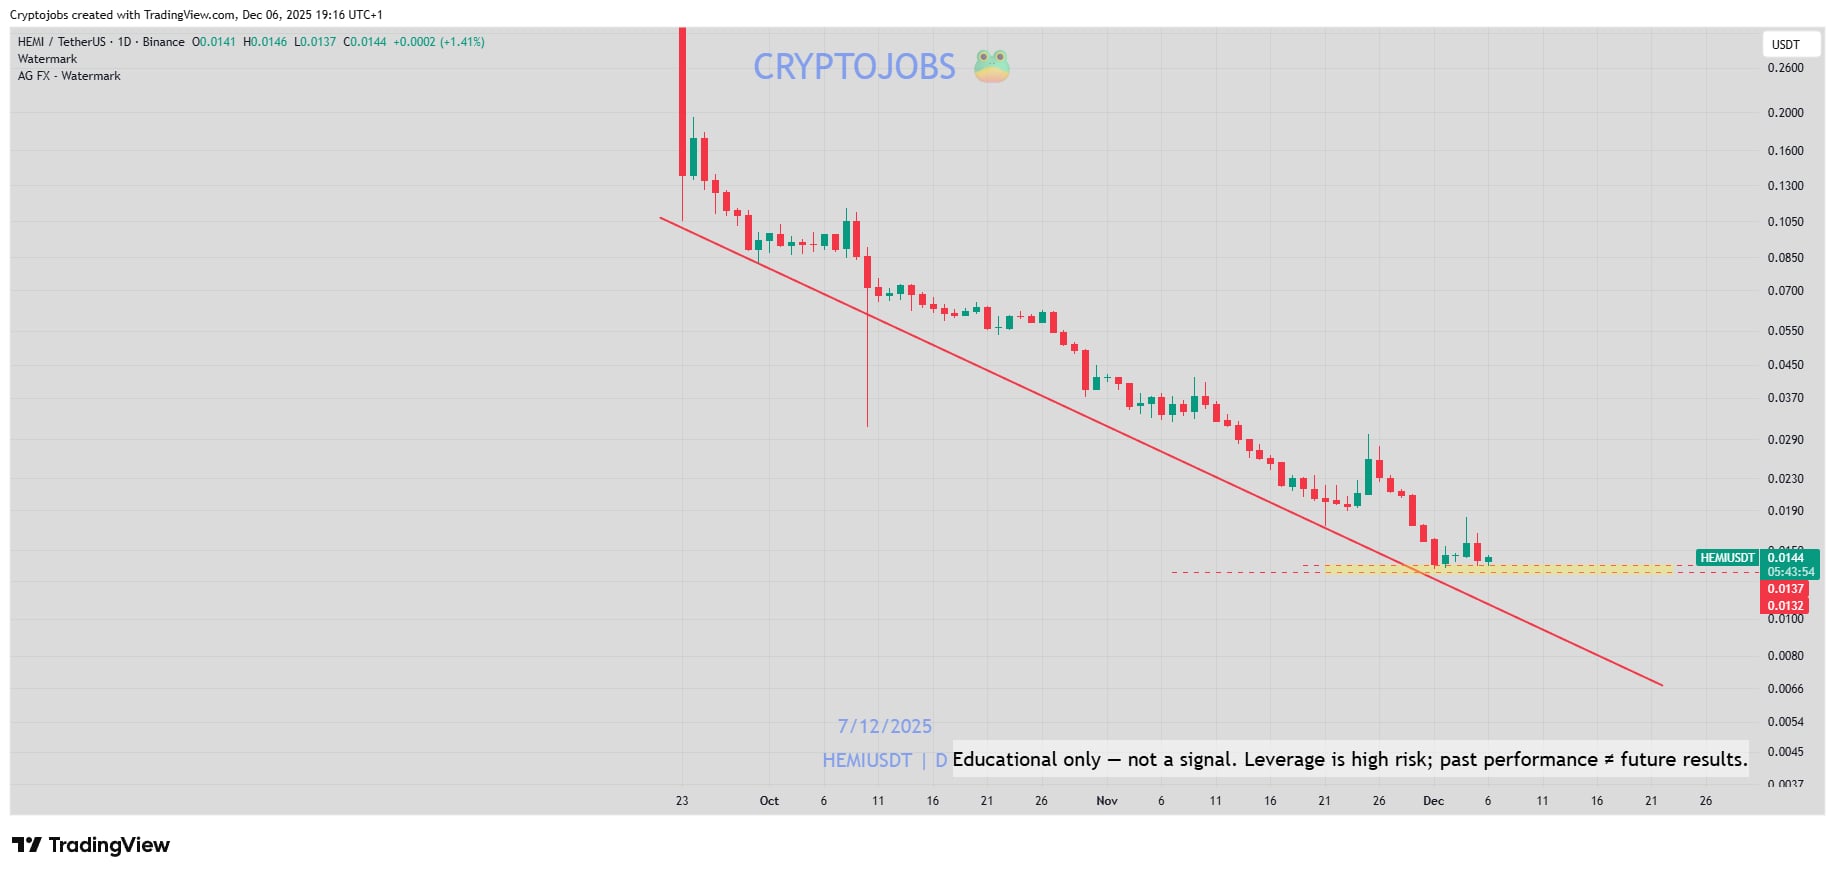
Before
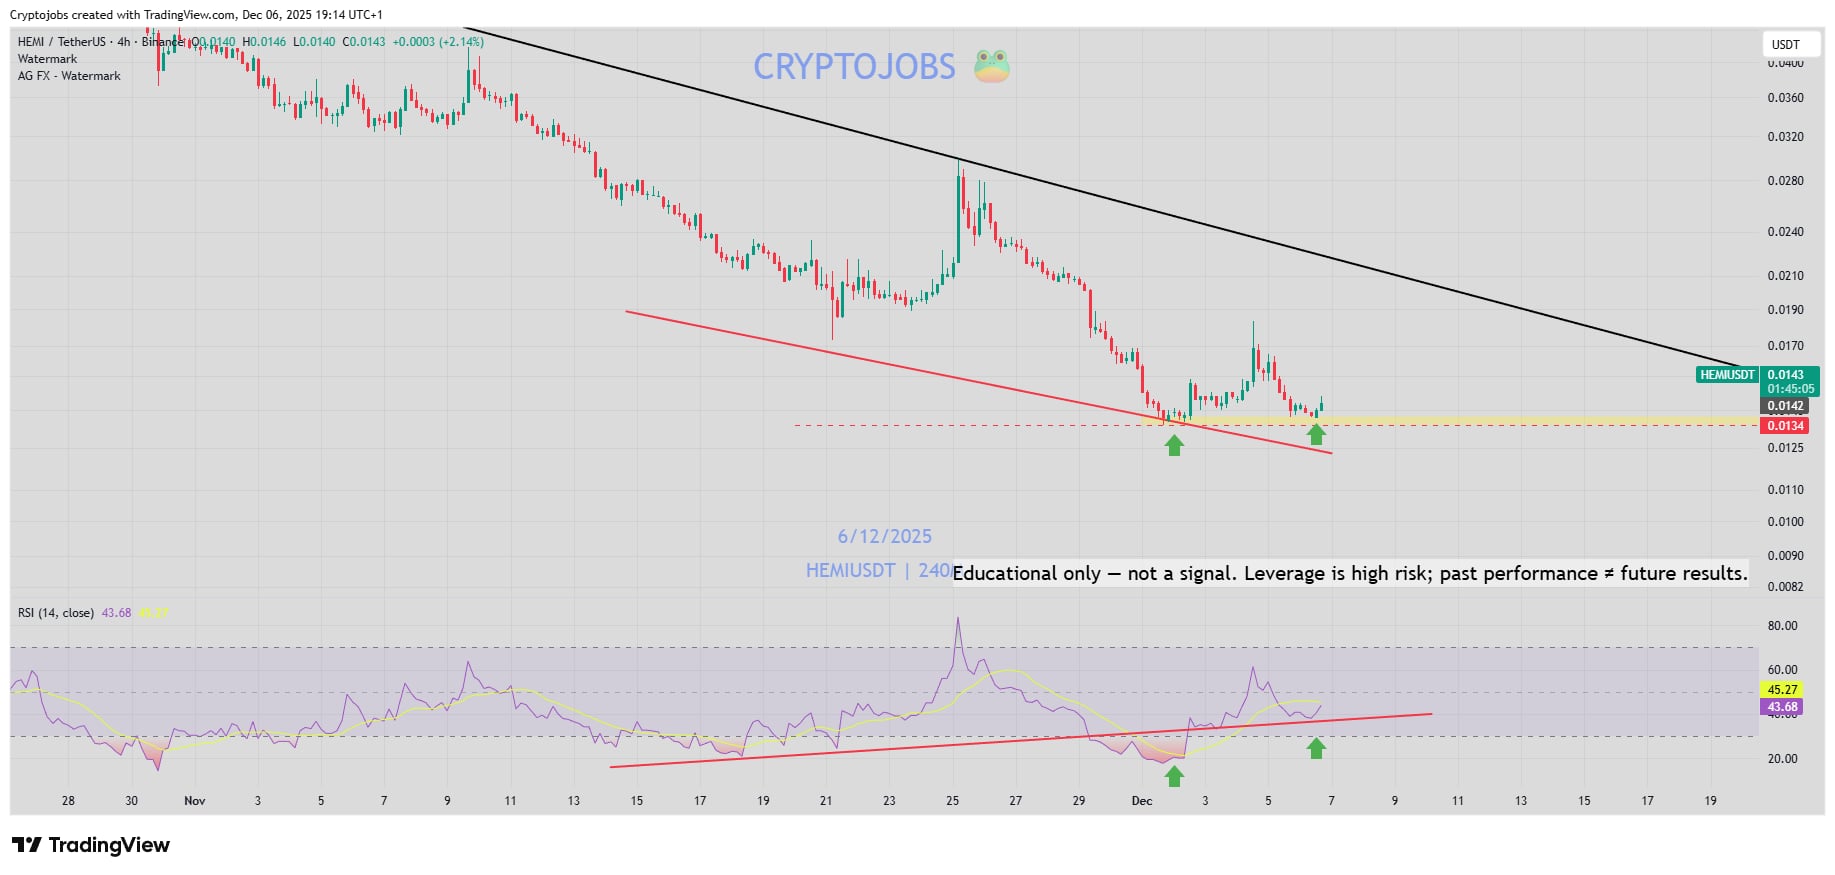
On December 6, 2025, HEMI was sitting on a demand zone around 0.0132 to 0.0137, at the bottom of its falling channel on the 4H and daily charts, with a bullish RSI divergence. I flagged it as a possible long-term bottom.
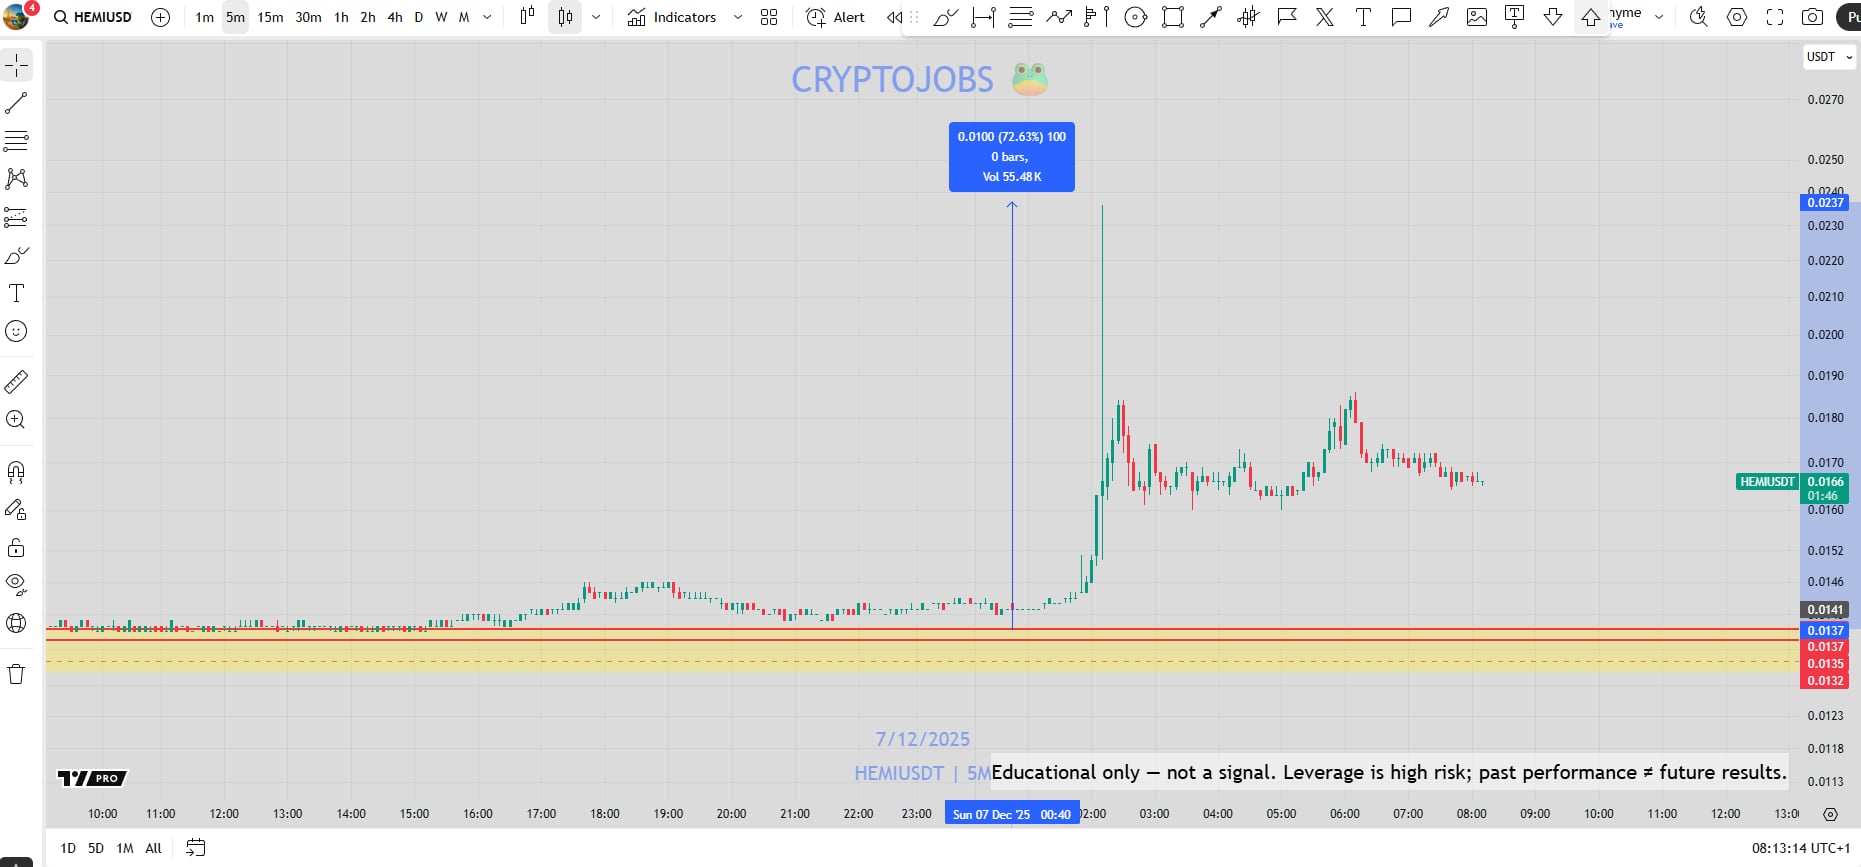
After
On December 7, 2025, HEMI held the zone and spiked hard from 0.0137, with a wick up to 0.0237.
Result
About +72% from 0.0137 to the 0.0237 high, measured on the chart. NFA.