Before
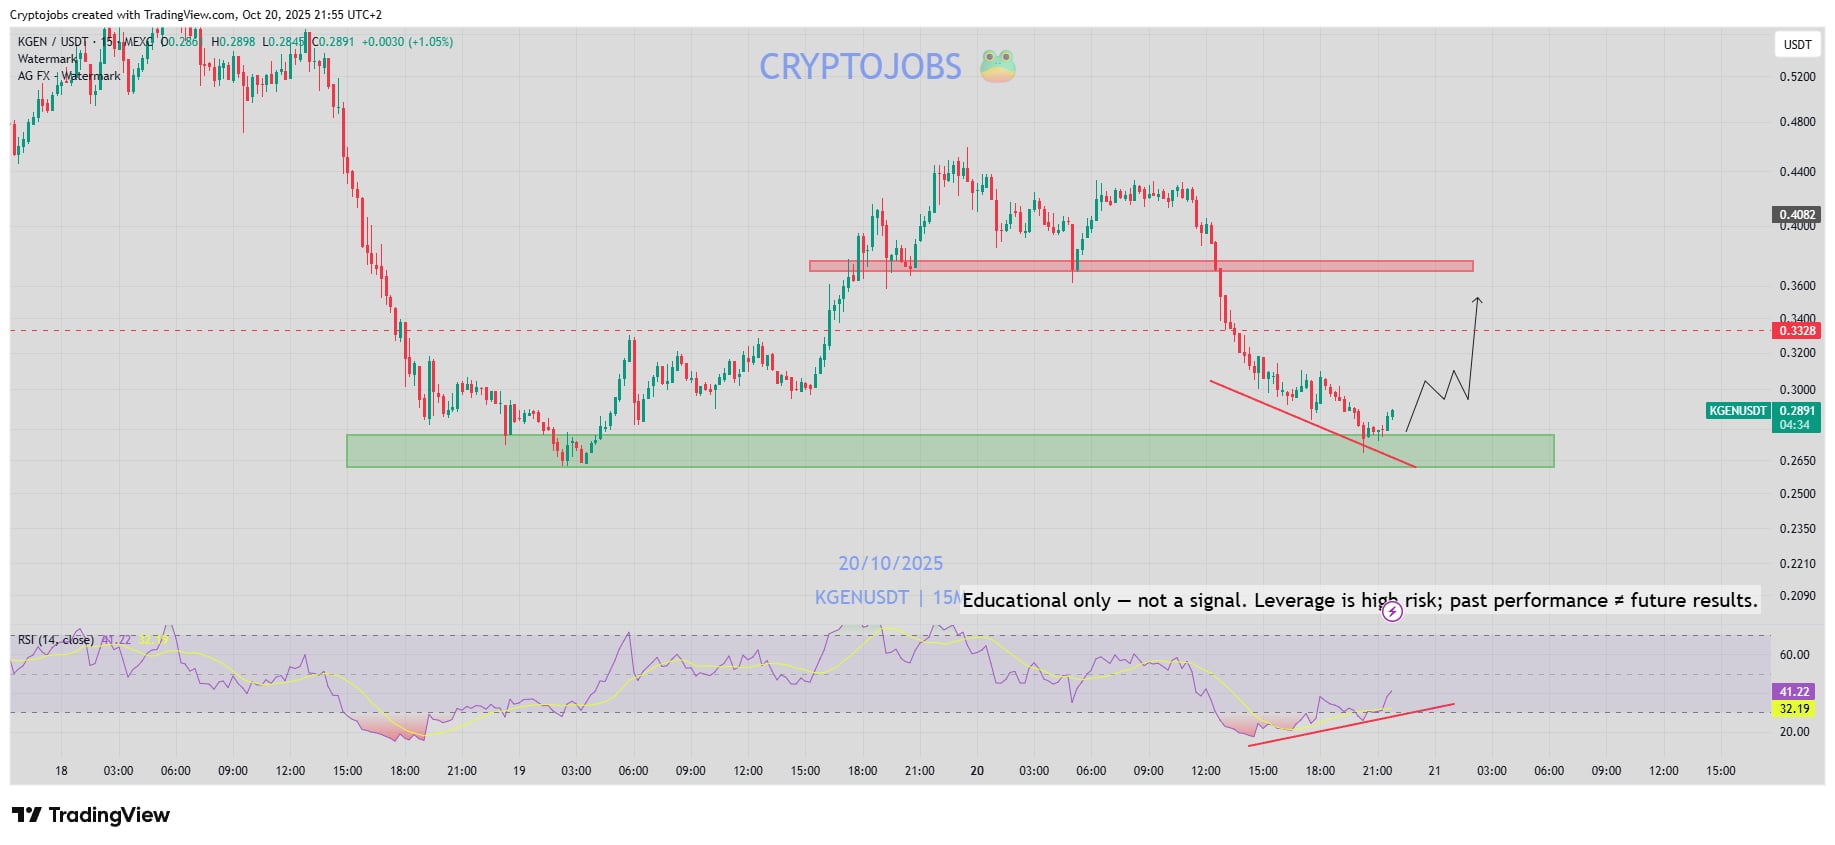
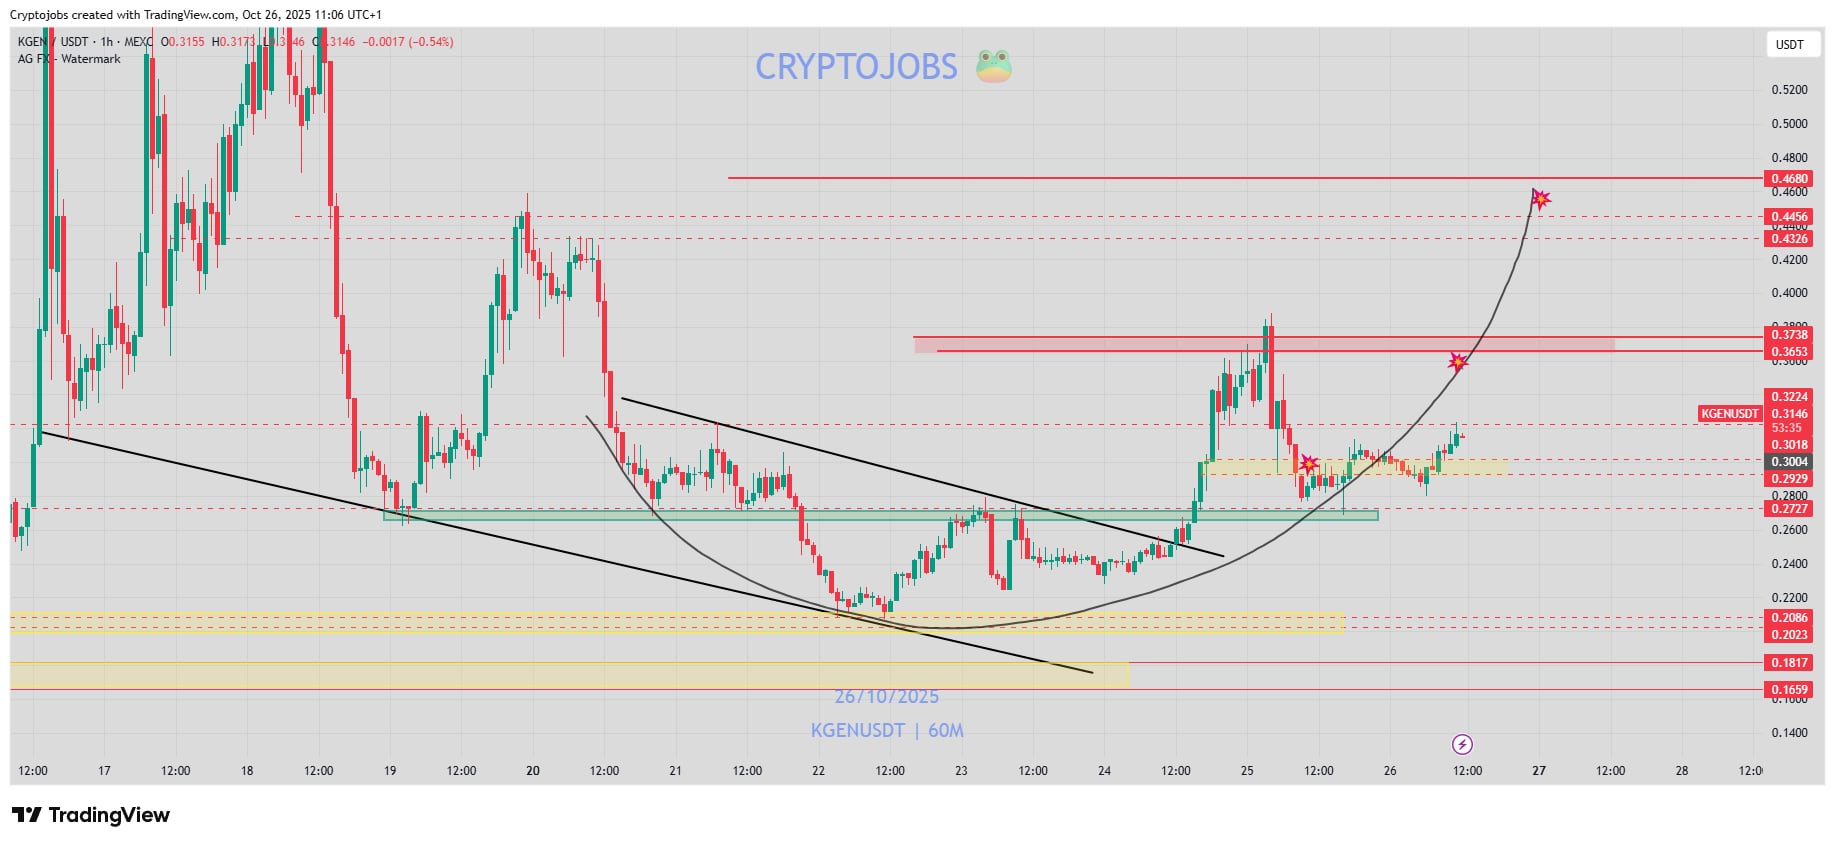
On October 20, 2025, KGEN was testing a demand zone around 0.265 to 0.28 on the 15m chart, with a bullish RSI divergence. I mapped a bounce toward 0.3328 and above.
After
Price first swept below the zone, then broke out of its falling channel and rallied to a high near 0.38 on October 25, 2025.
Result
About +35% from the 0.28 zone to the 0.38 high, measured on the chart. NFA.