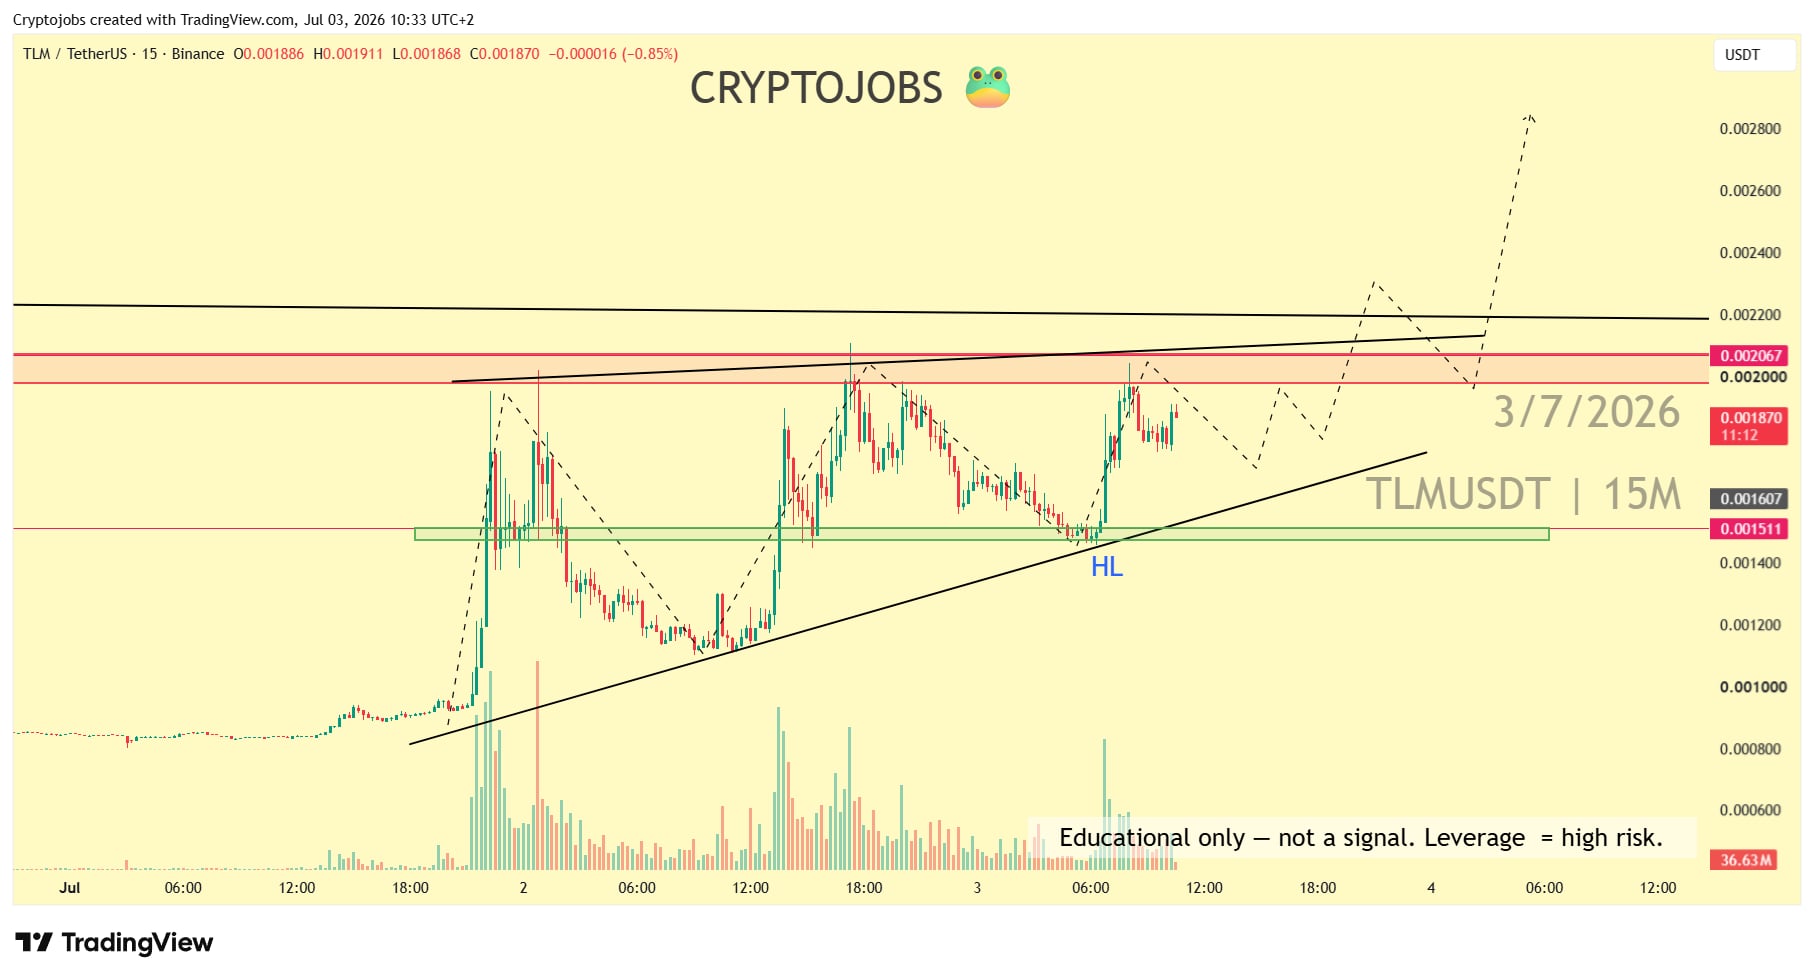
Before
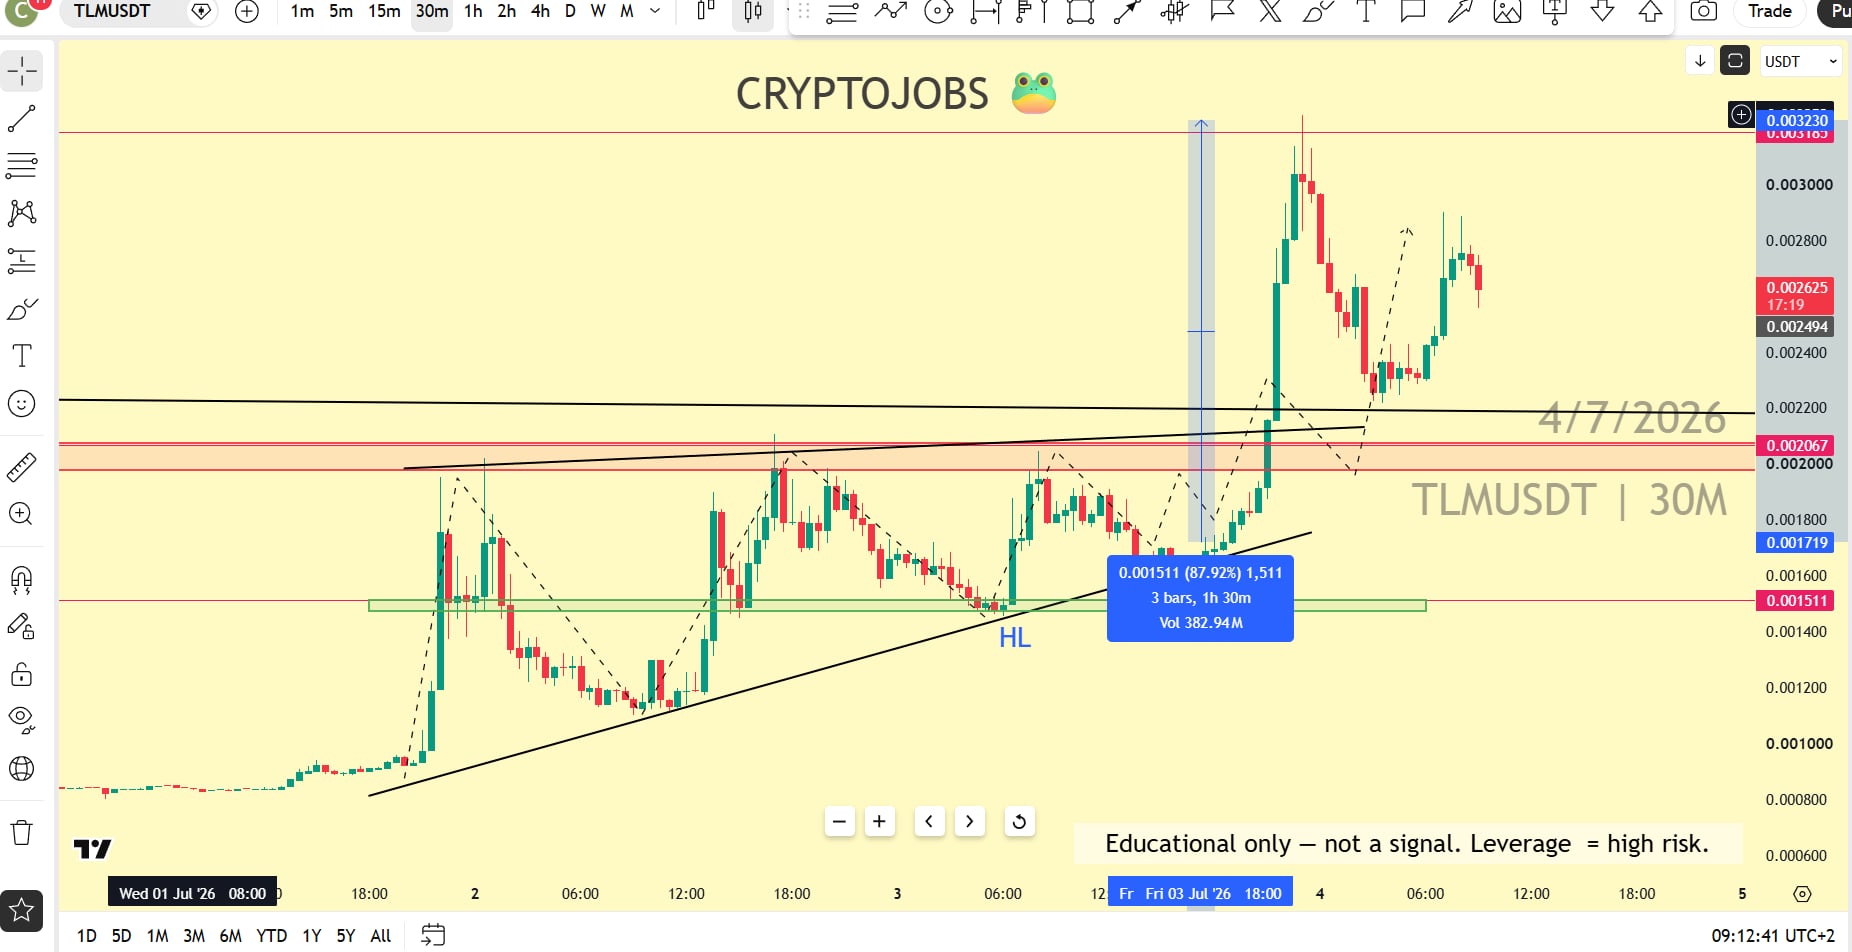
On July 3, 2026, TLM printed a higher low on the 0.001511 support zone on the 15m chart, inside an ascending triangle. I marked a long setup for a breakout above the 0.0020 to 0.002067 resistance.
After
On July 3 to 4, 2026, TLM broke above the resistance and ran up to about 0.003230.
Result
About +88% from the 0.001719 higher low to the 0.003230 high, on the visible chart. NFA.
Original post: See the CMC post