Before
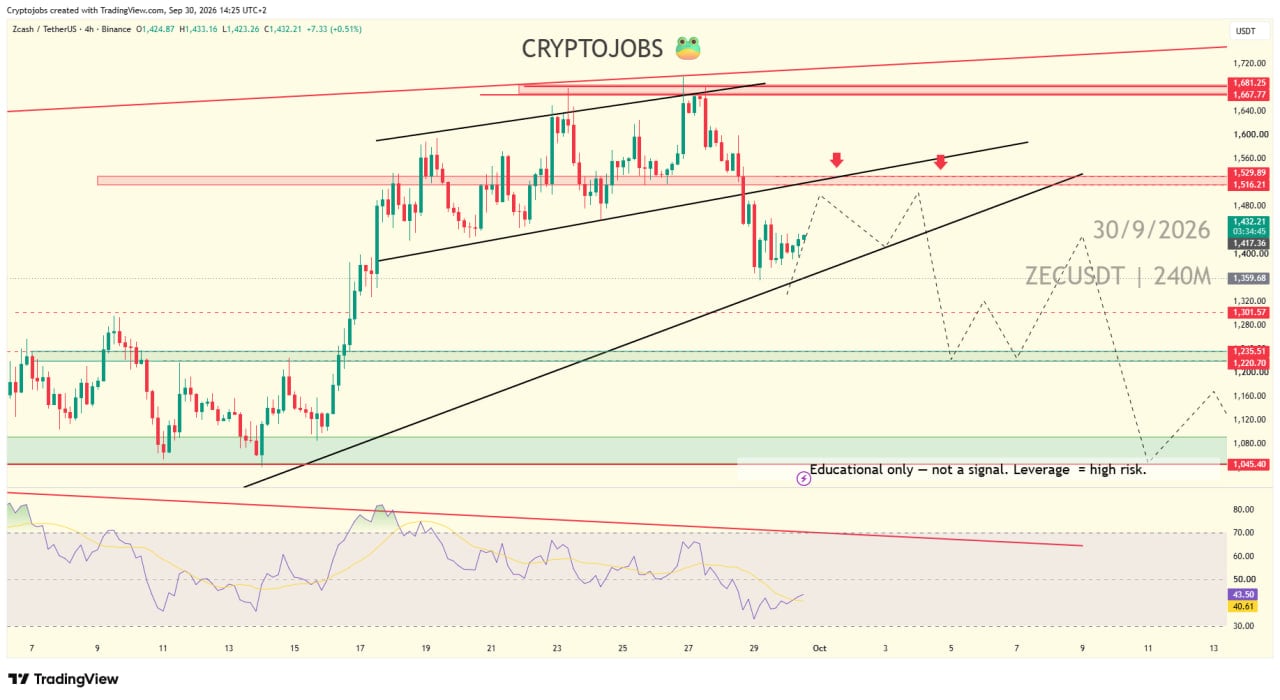
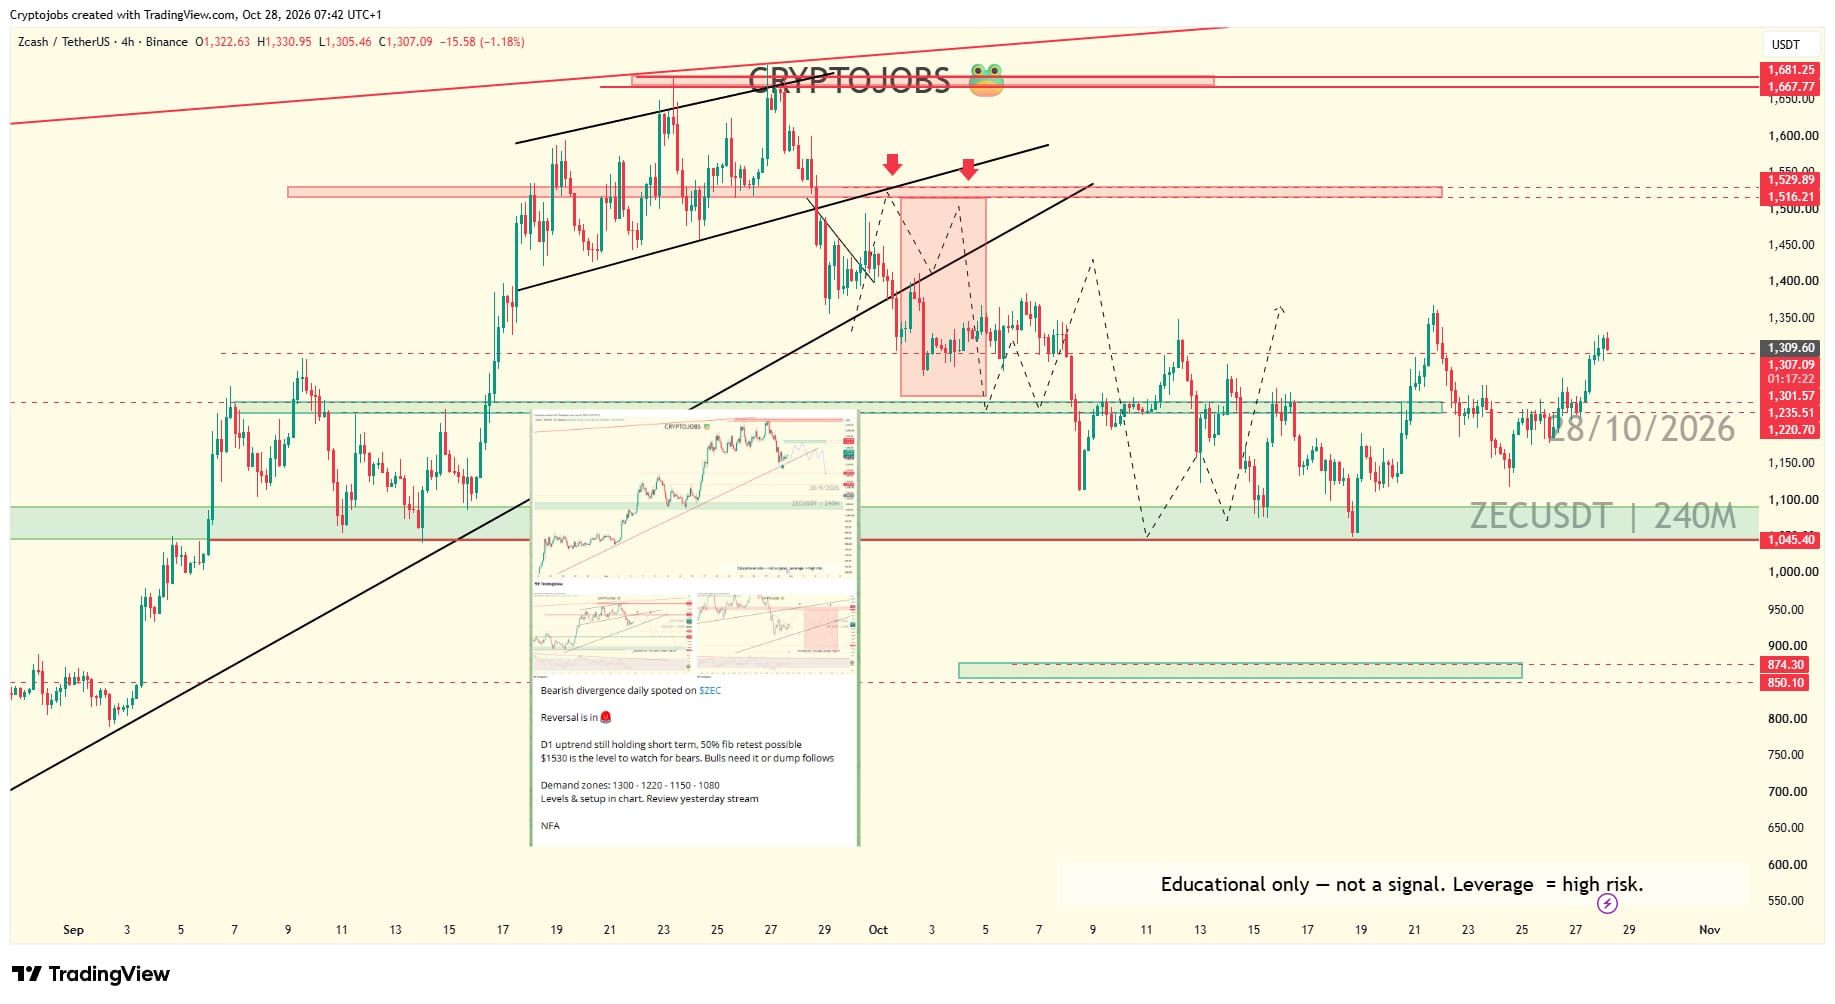
On 30 Sep 2026, $ZEC broke down from its rising wedge on the 4H chart around 1,432. The 1,516 to 1,530 zone was marked as the level bears had to defend, with demand zones at 1,300, 1,235 to 1,220 and 1,045 below. RSI showed a bearish divergence.
After
Price retested the broken wedge, rejected below 1,530 and dropped through 1,300 and 1,220. It reached the 1,045 demand zone in mid October before bouncing.
Result
From 1,432 to the 1,045 zone: about +27% on the short side.
Past results do not guarantee future moves. Educational only. NFA.