BTC Weekly Outlook: Week of Nov 2, 2026
A fresh Bitcoin read every Monday: macro context, key levels and the setups for the week ahead.
BTC WeeklyETH Weekly
Setup fully completed
Setup fully completed means price reached every target in that week's setup. It is marked after the move has played out, so it is a record of the result, not a new signal.
All targets hitYou're reading an older week.Back to this week
Week of Nov 2, 2026
BearishBTC/USDT · 1W
Market Bias
Bias
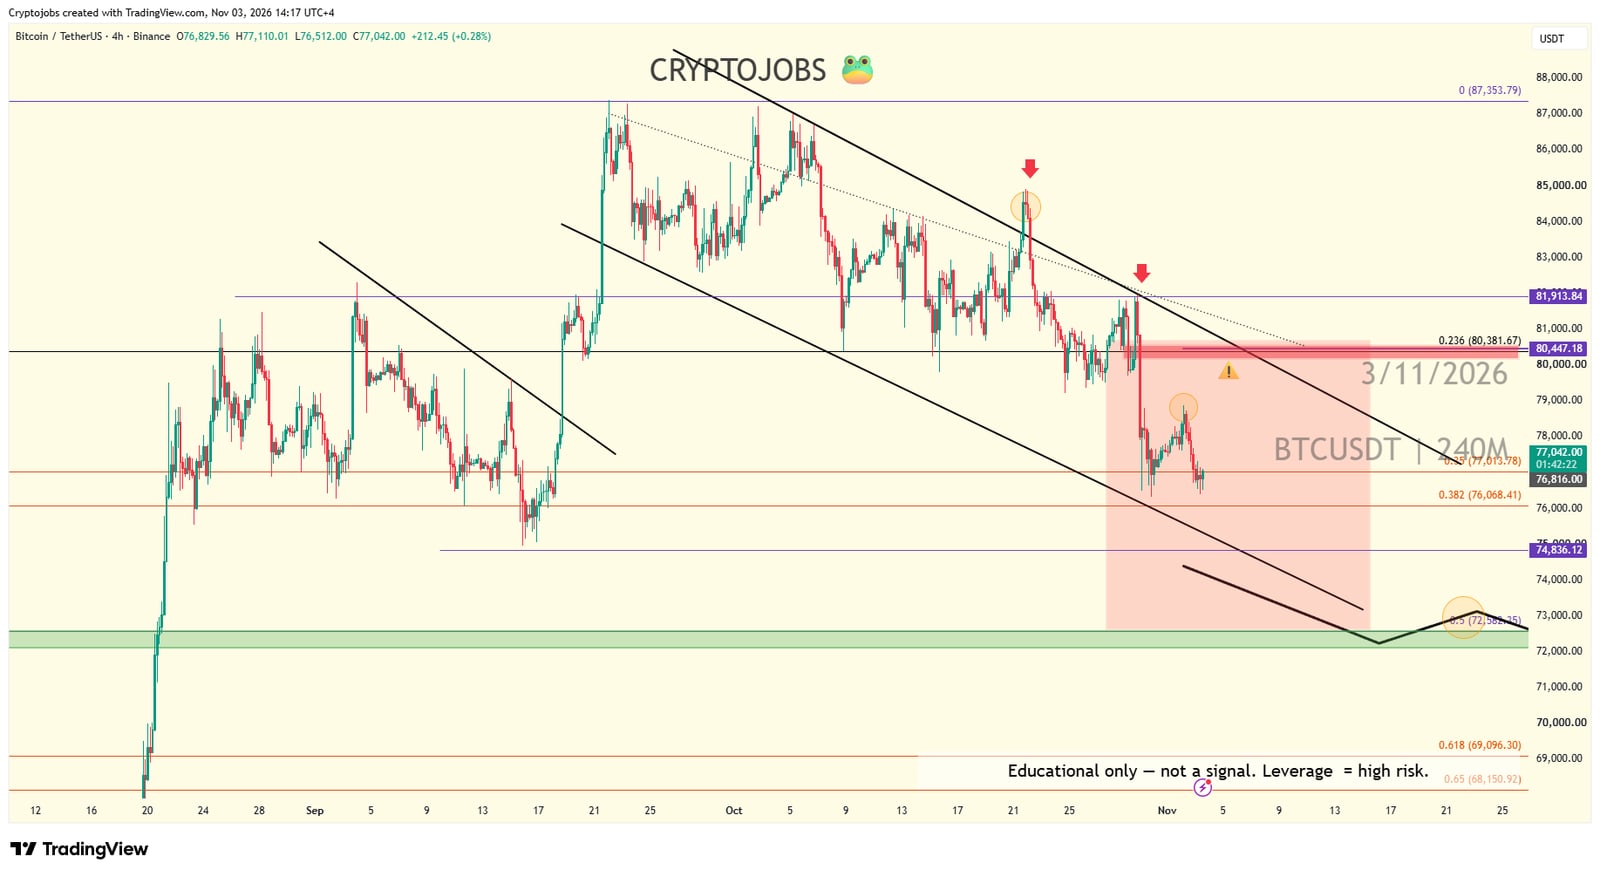
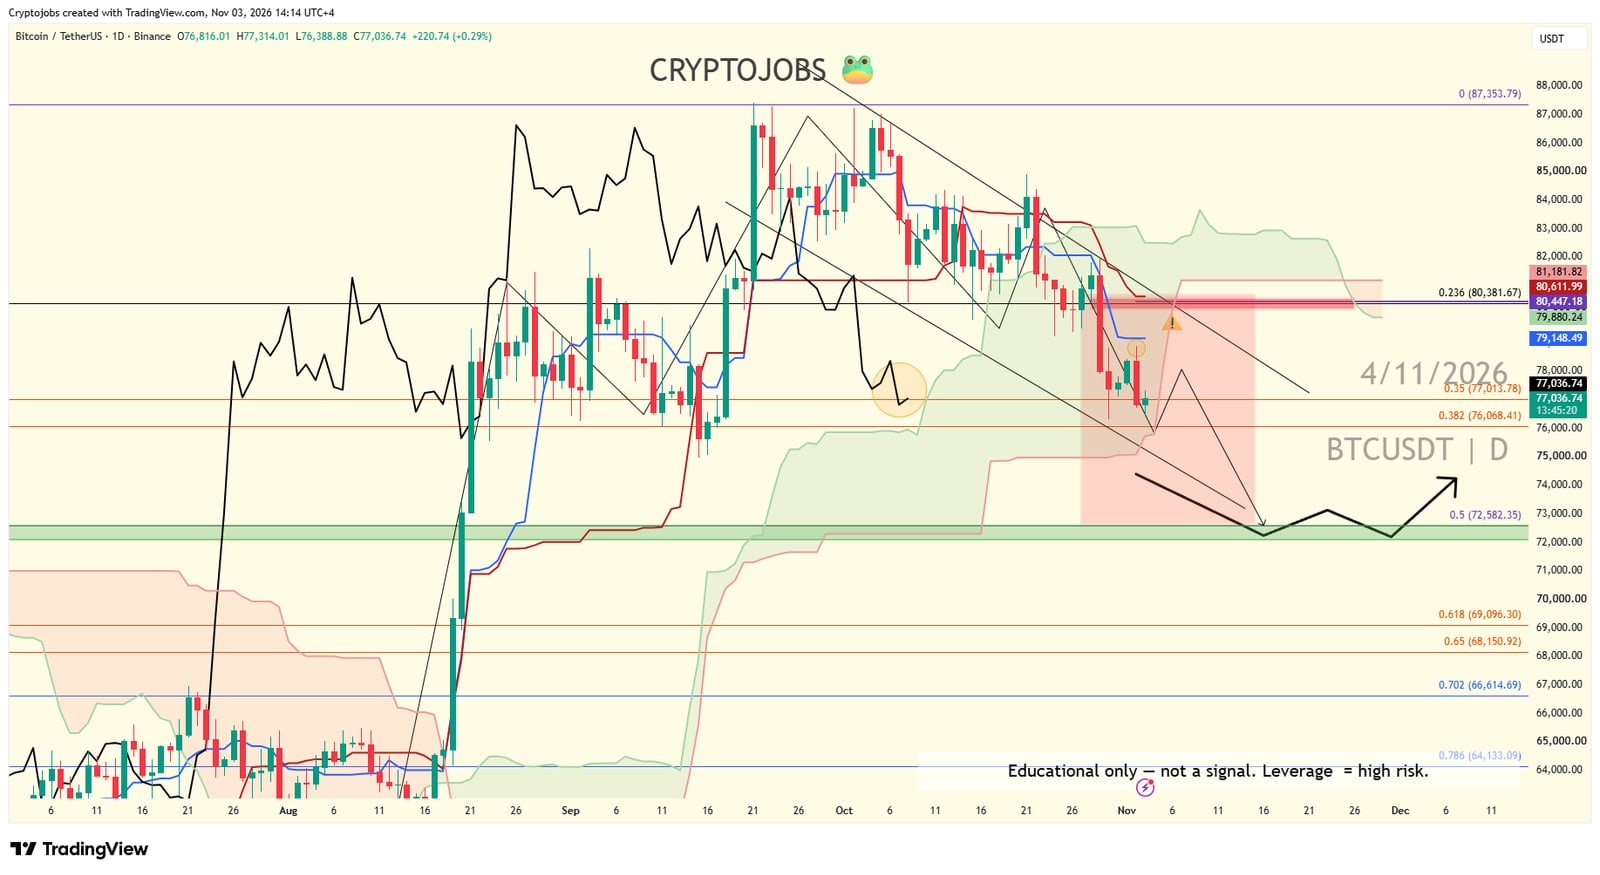
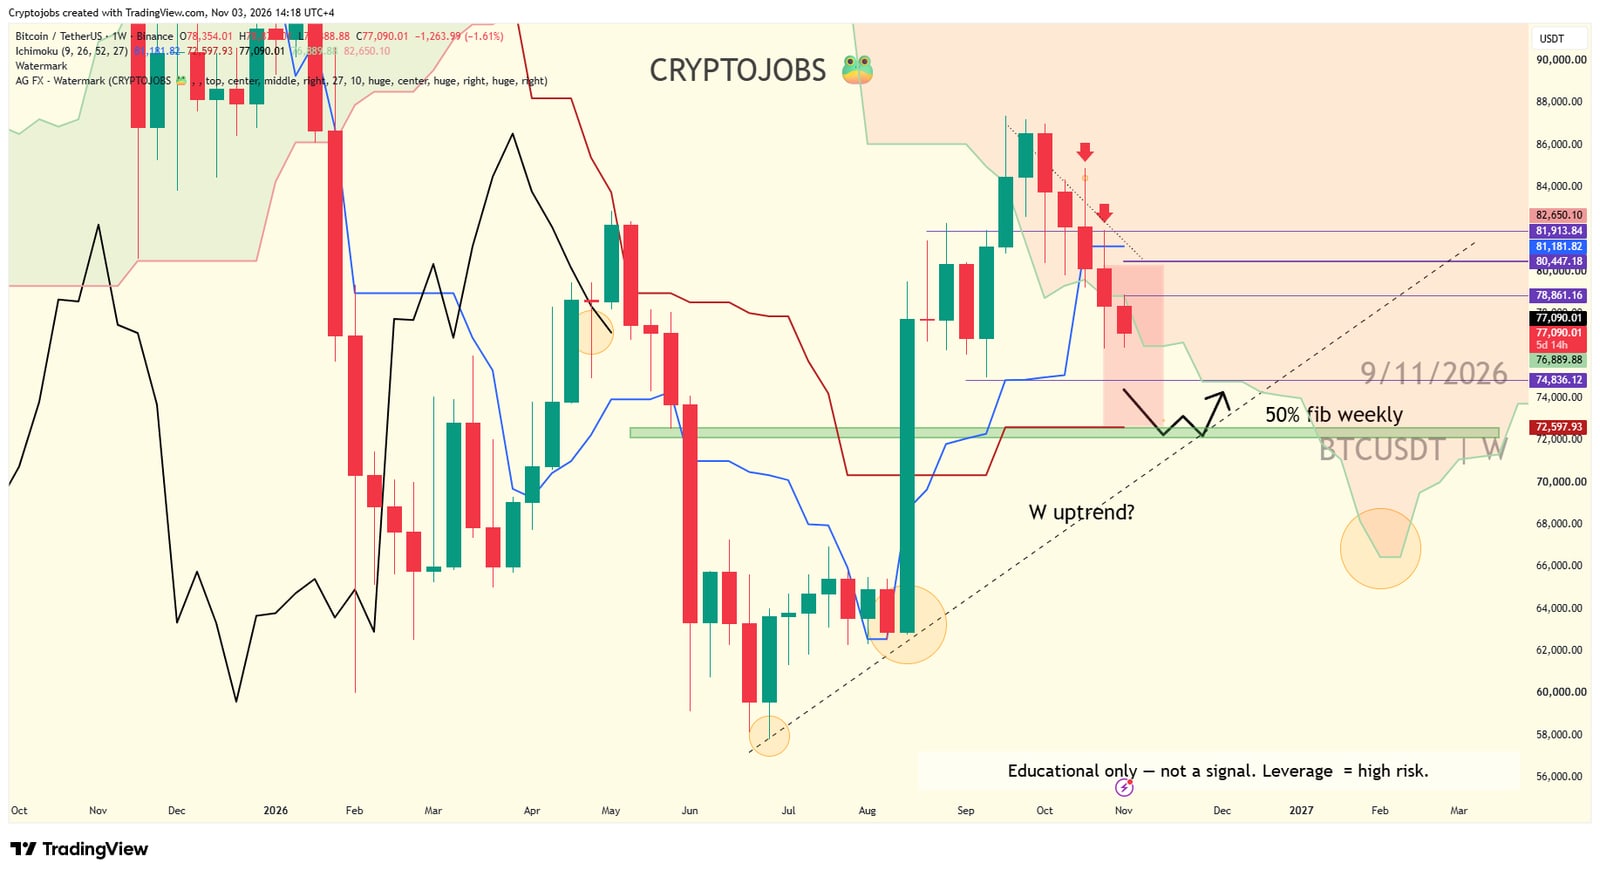
Bearish under $81,000, and especially under $79,000.
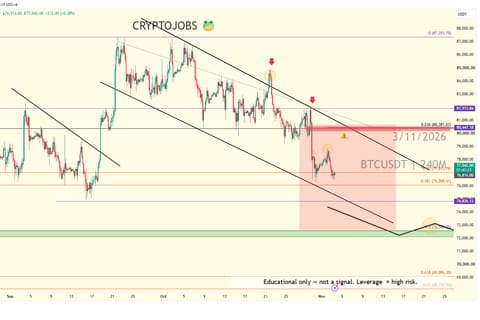
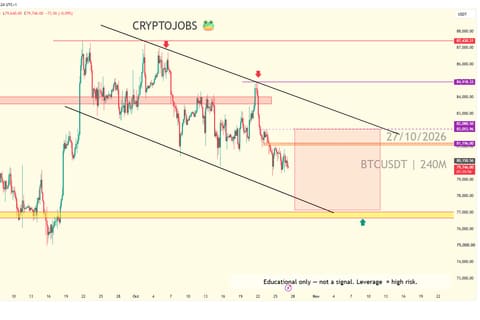
The previous weekly outlook played out as expected: the break of $78,500 led to a drop toward the first demand zone at $76,500, which is now reached.
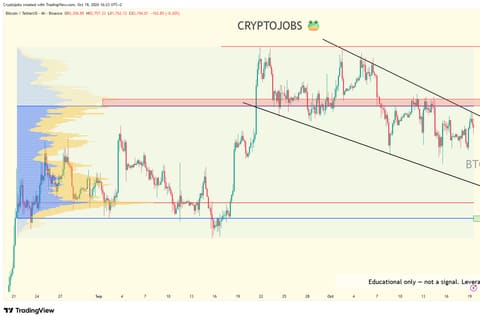
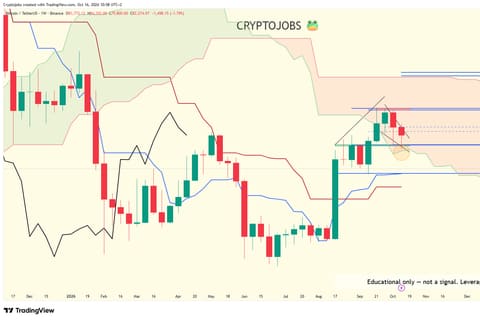
BTC is in a sideways zone on the daily and weekly timeframes, and price remains trapped inside the H4 channels. The daily chart shows a clean bearish sign, with a potential breakout of the KUMO incoming.
Spot Bitcoin ETFs saw net outflows of $398.6M on Nov 2, after $643.3M on Oct 30. Macro this week: JOLTS on Tuesday at 15:00 UTC and the US jobs report (NFP) on Friday at 13:30 UTC.
Key Levels to Watch
- Resistance: $79,000 (previous D1 high and Tenkan rejection)
- Resistance: $81,000
- Support: $76,500 (first demand zone, reached)
- Support: $72,000 (next key zone to watch)
- Bearish bias: valid under $81,000
Trade Setup
Scenario
Bears remain in control under $81,000, and especially under $79,000.
Price action may be tricky, especially if support holds at $76,500, but the bias stays bearish.
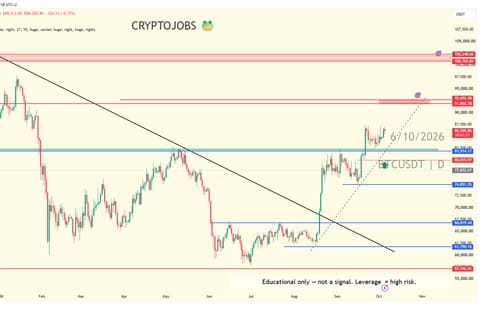
Supports are becoming weaker judging by the price structure. $72,000 is likely the next key zone to watch. Details in the chart.
Same chart, same outlook, same timeframe. Without invalidation, patience is key.
NFA
Quick Stats
Current Price…
Weekly Change…
SupportResistance
76,500 to 72,00079,000 to 81,000
Past Outlooks
7 weeks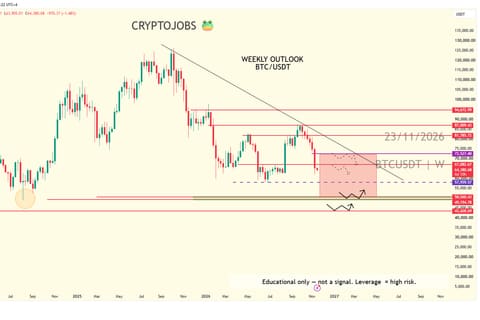
This week
Bearish · S $62,000 · $58,000 to $58,500 · $48,000 to $50,000 · R $68,300 · $69,400 · $70,000 · $72,500
November 2026
Week of Nov 9, 2026
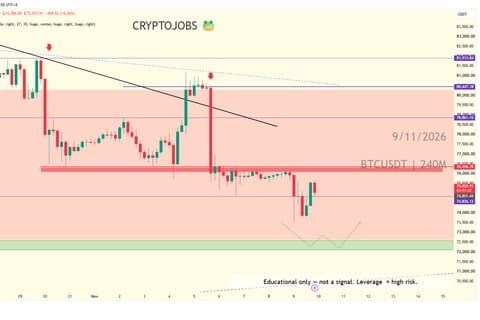
Bearish · S $72,500 to $72,000 and $65,600 to 64,700 · R $77,500 to $80,500
Setup fully completed
Setup fully completed means price reached every target in that week's setup. It is marked after the move has played out, so it is a record of the result, not a new signal.
Want context on this week's BTC read, or live coverage as price moves?
This is the public weekly recap. For a deeper walkthrough of the levels and what to do at each one, or live alerts when BTC tags them, book a 1:1 session or join VIP.