Before
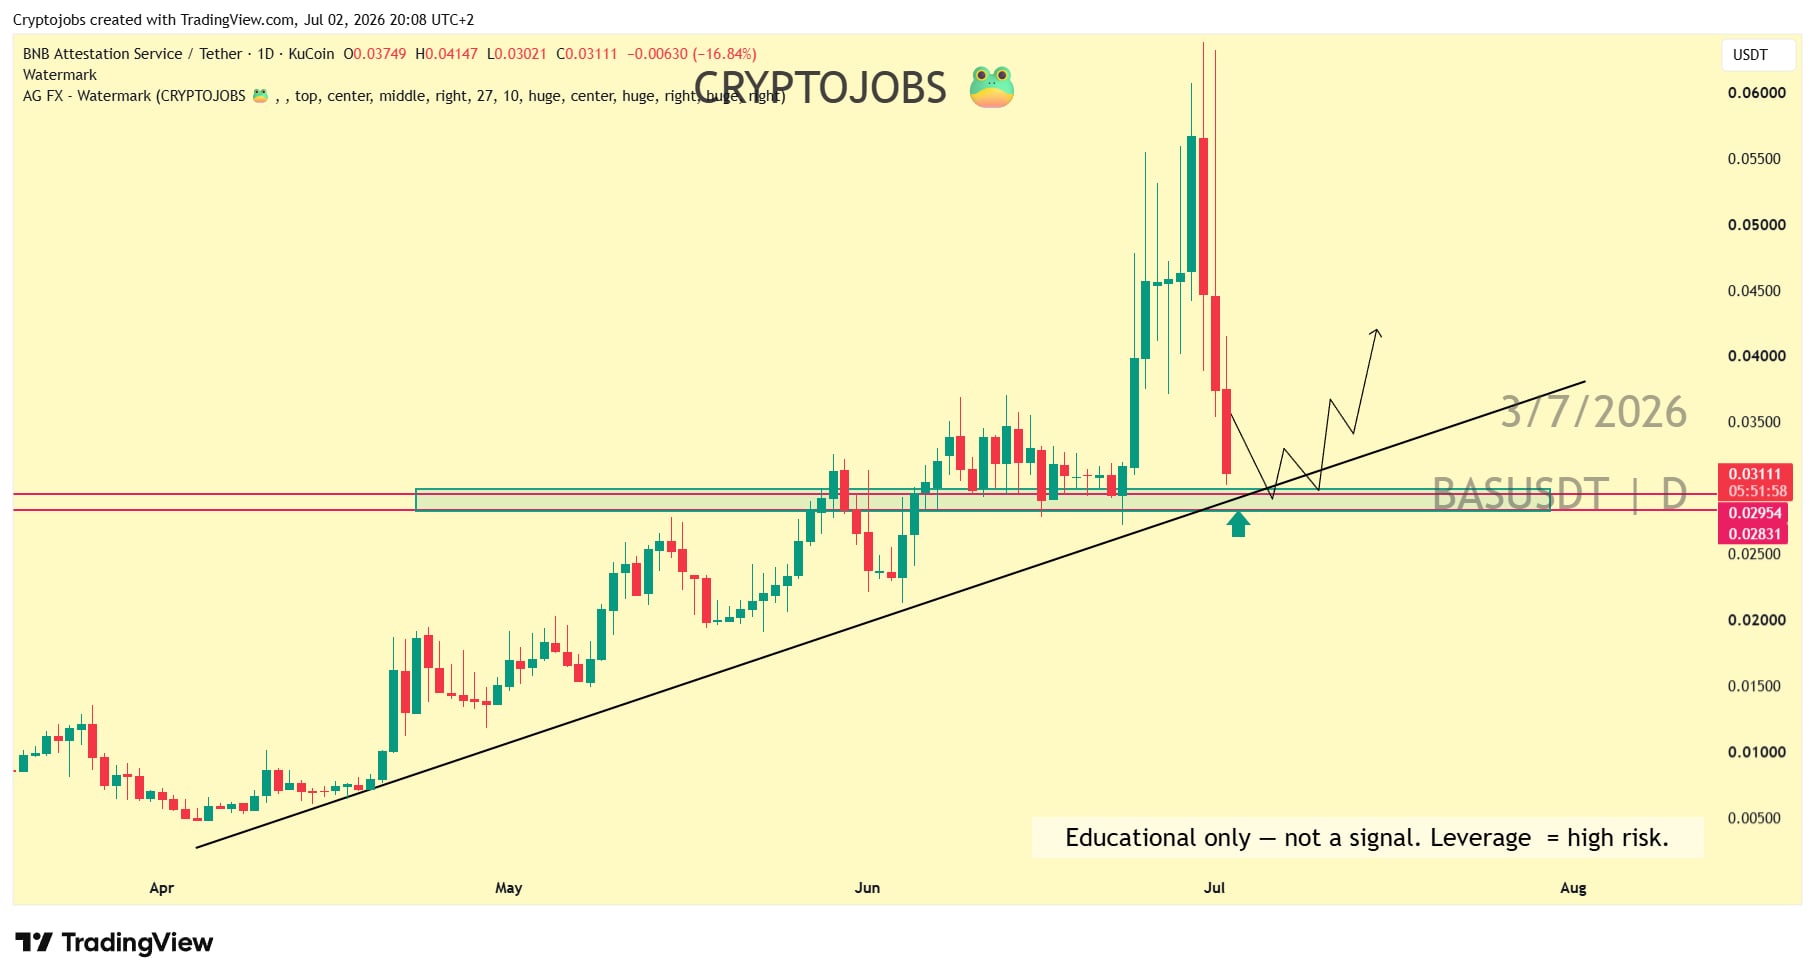
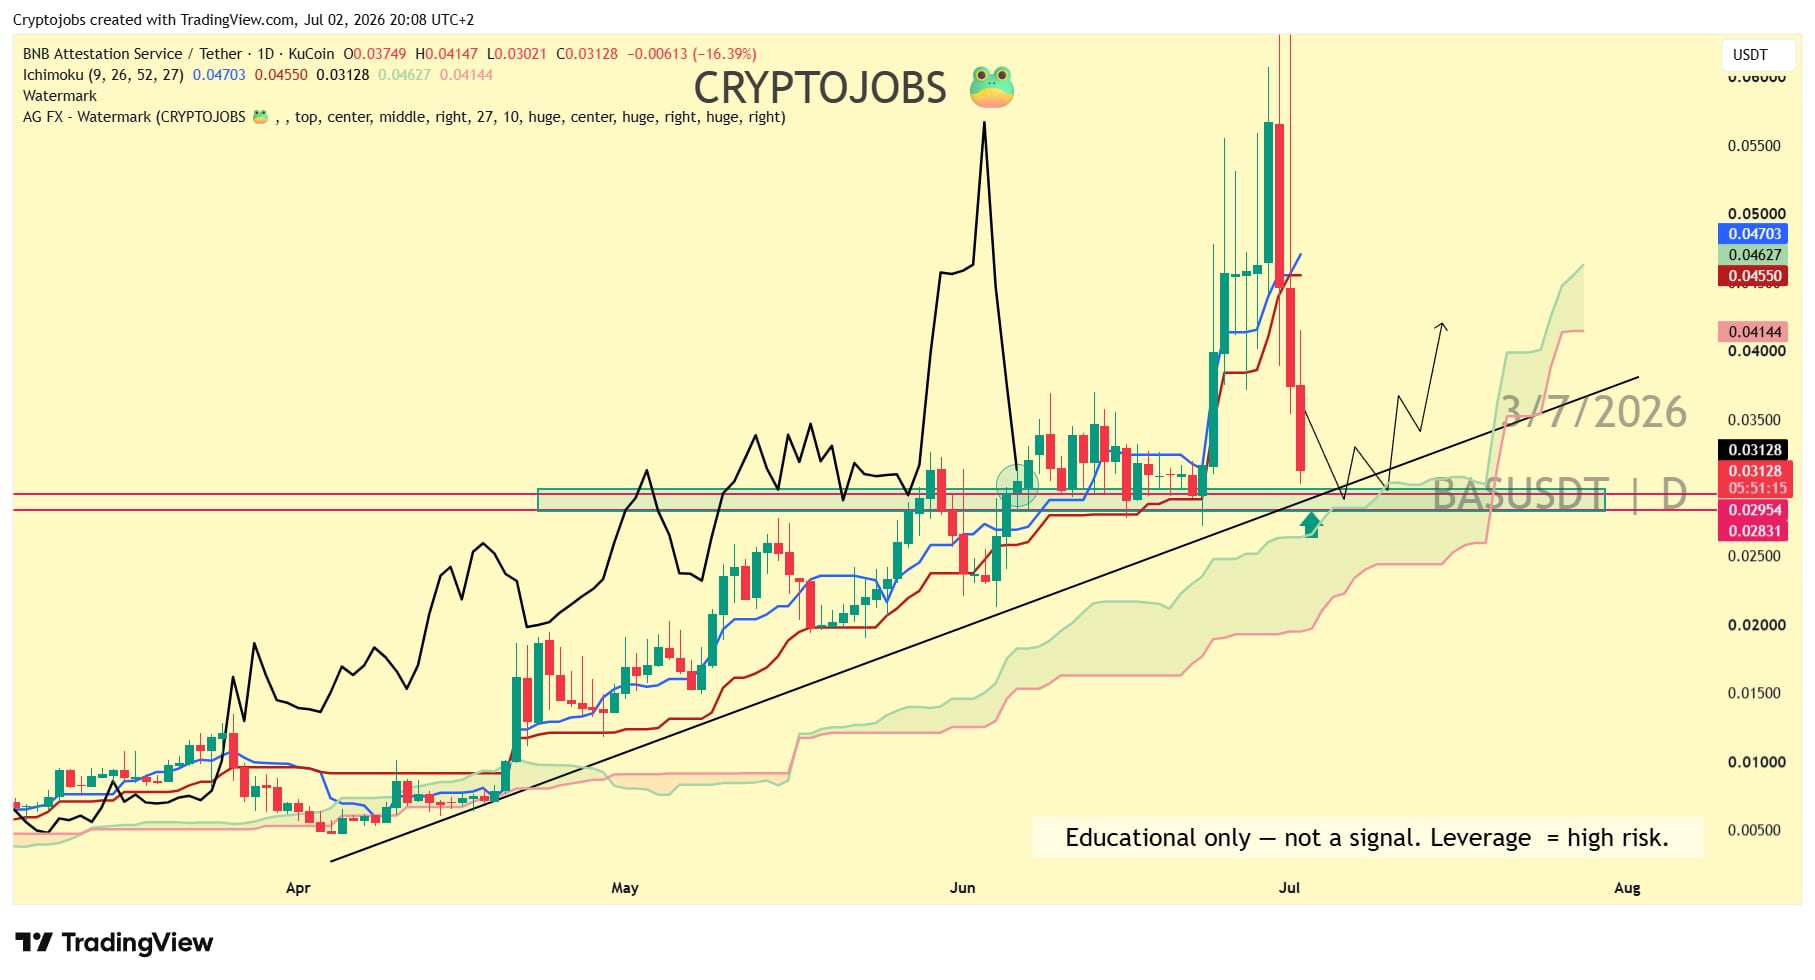
On July 2, 2026, BAS pulled back into the 0.0283 to 0.0295 demand zone on the daily chart, right on its rising trendline. I marked it as a buy-the-dip area for a bounce.
After
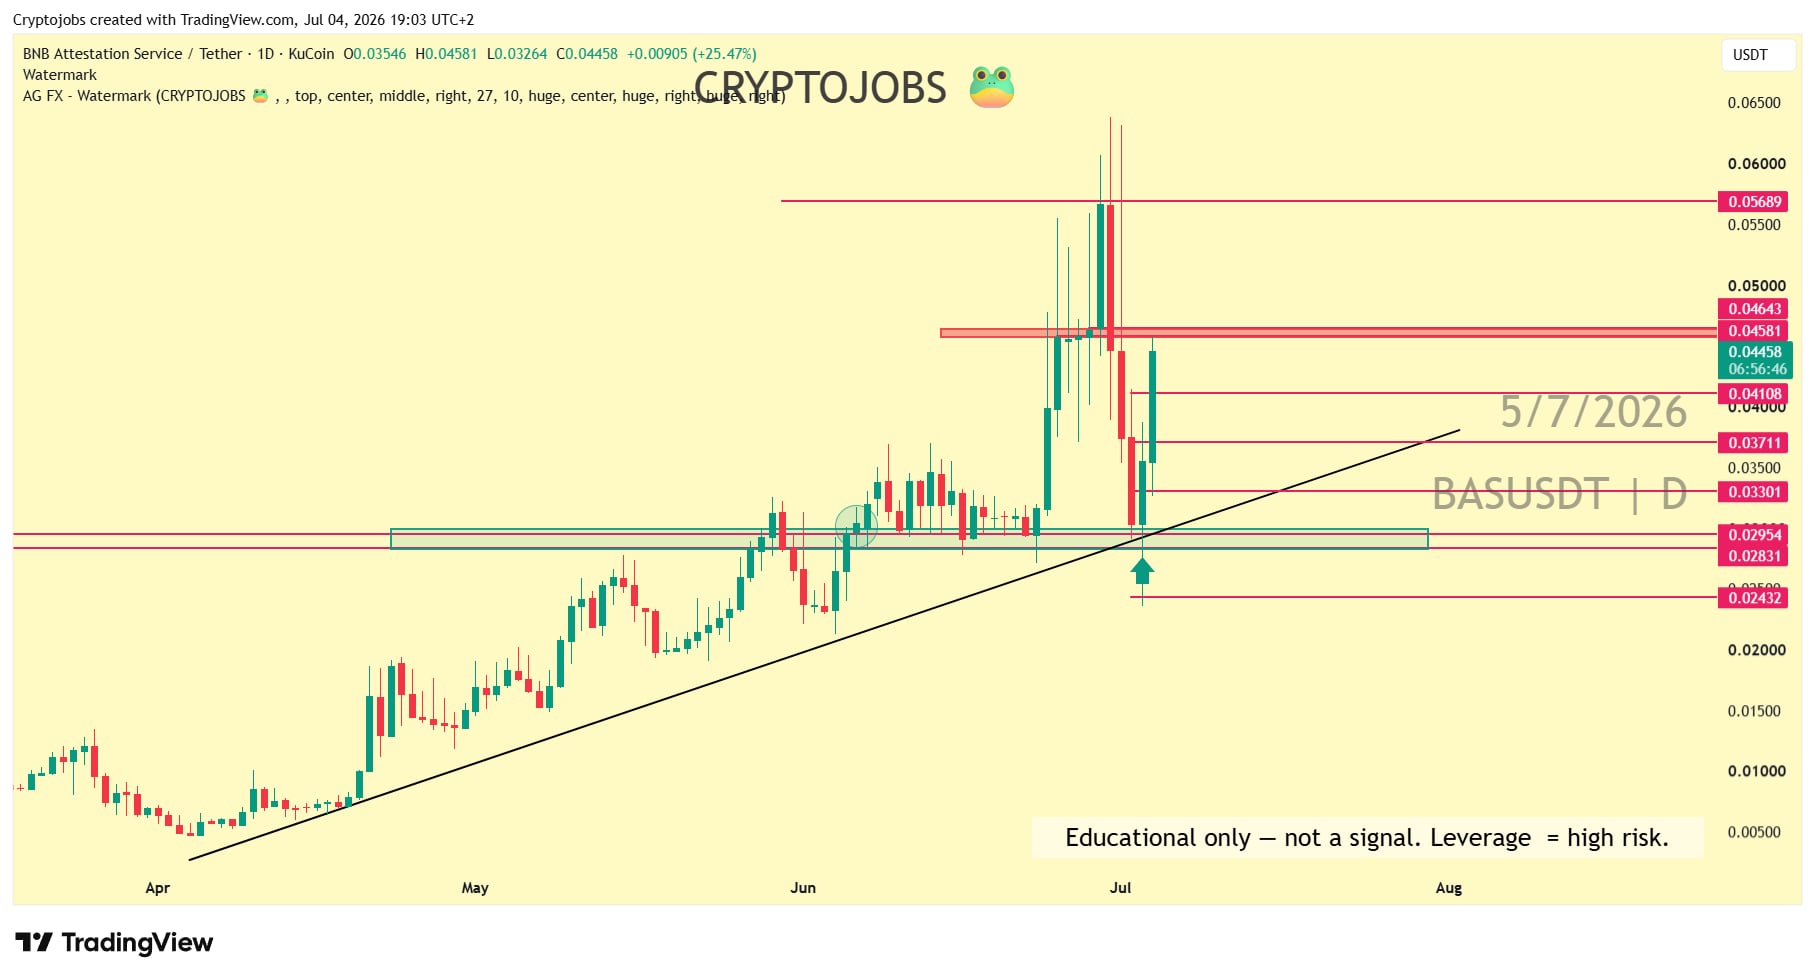
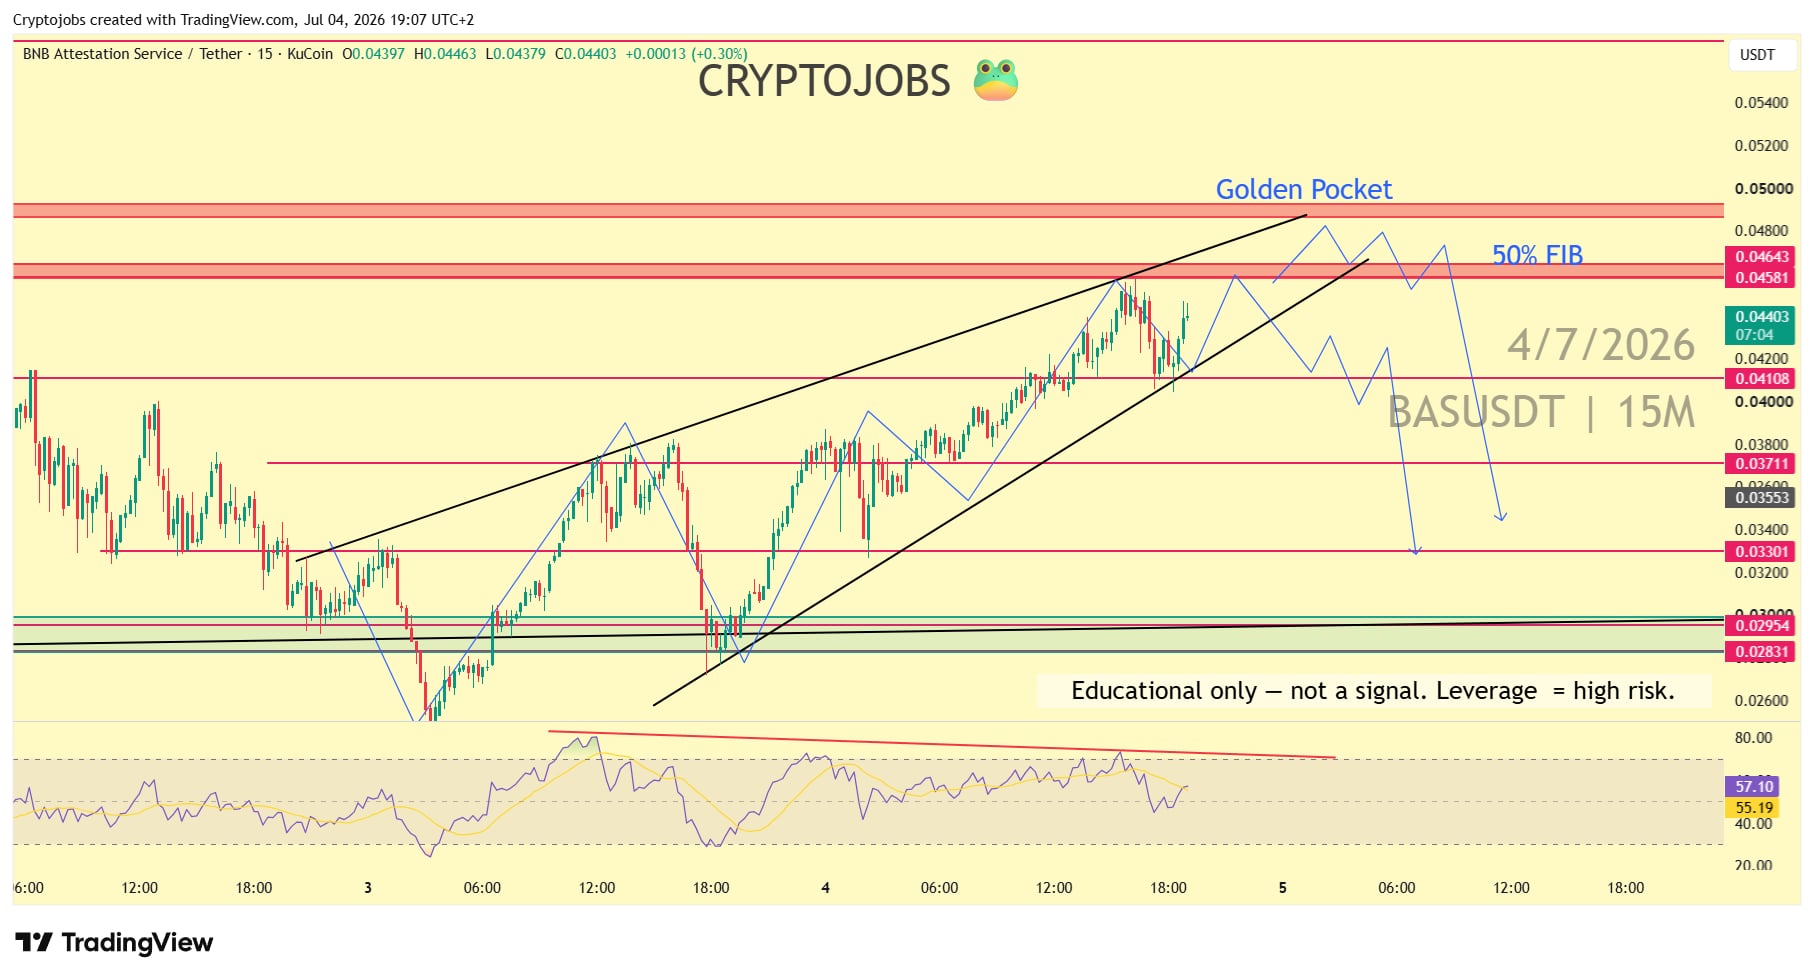
By July 4, 2026, BAS had bounced from the trendline and pushed back up to the 0.0458 to 0.0464 resistance.
Result
About +86% from the bottom to the 0.0458 resistance, on the visible chart. NFA.
Original post: See the CMC post