Uptober was supposed to be the easy month. Instead, $BTC lost about 7.3% in October and closed near $77,400. Here are five numbers that put November in context.
1. About 7.3%: what October did
The month started well. $BTC touched roughly $87,000 in the first week, after three green months in a row (July, August and September). Then it faded, and on Oct 30 it hit a six-week low near $76,100. Exchanges differ by a few hundredths of a point on the close, so I say about 7.3%.
2. 3 of 13: how rare a red October is
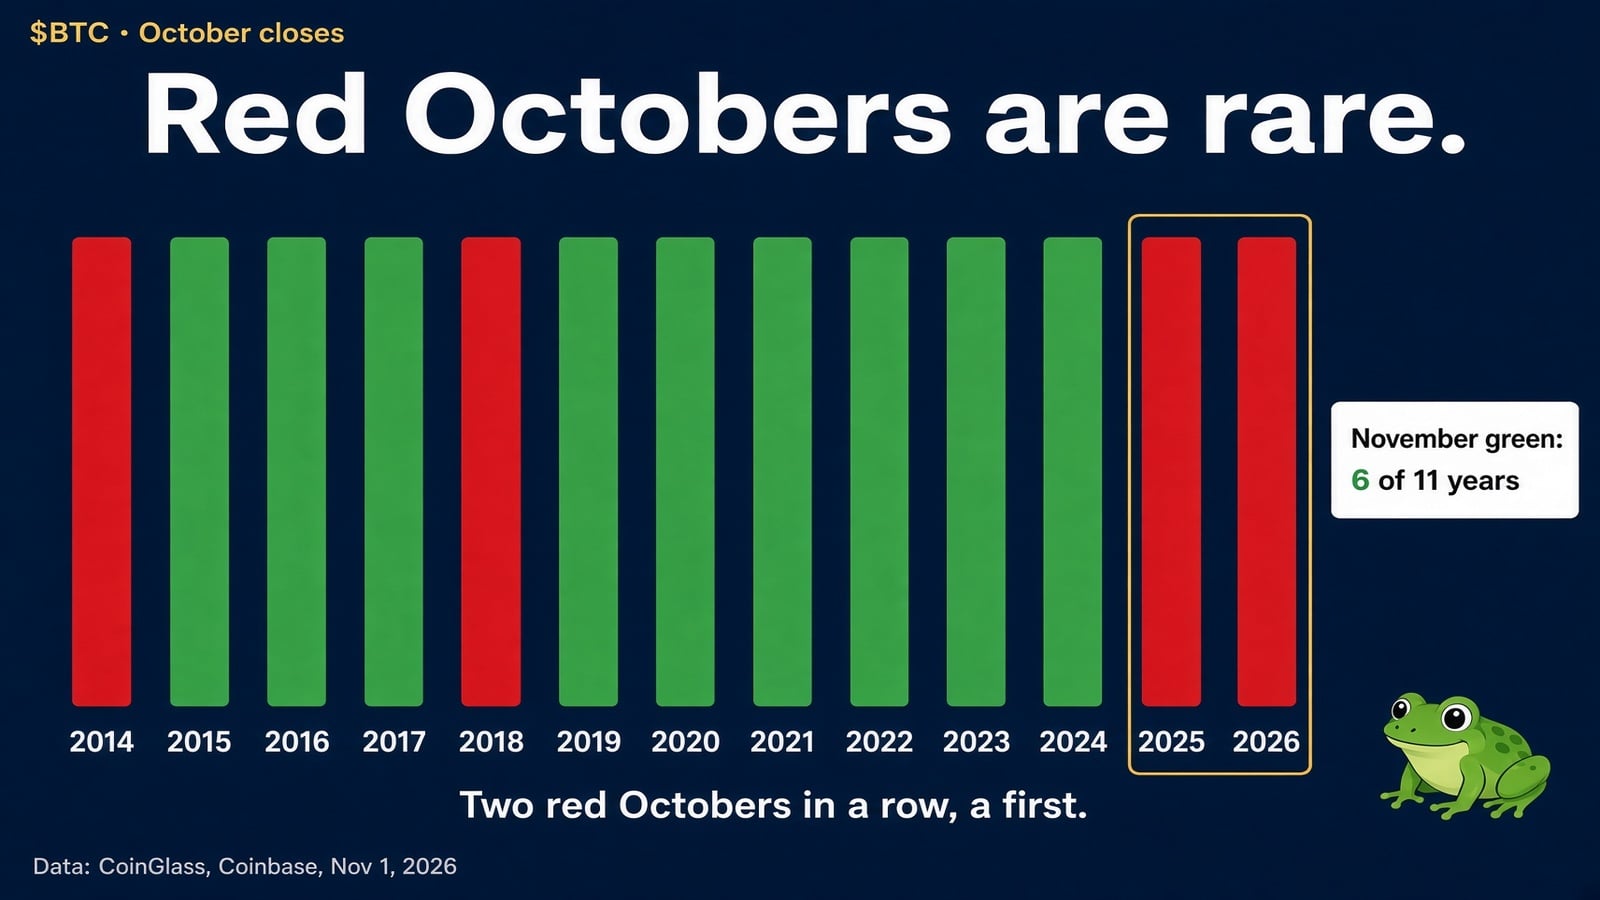
CoinGlass counts 10 green Octobers out of 13 from 2013 to 2025, with a median gain of 14.6%. The three misses were 2014, 2018 and 2025. With 2026, that is the first pair of red Octobers in a row in that record.
Watch what came next after the last two misses. November 2018 fell about 36% and November 2025 fell about 17.5%. Two cases is a caution, not a rule, and I did not verify 2014.
3. 6 of 11: what November really does
CoinGlass shows a November median of +8.8%, but the average of +41.3% is inflated by a 450% month in 2013. On Coinbase daily closes from 2015 to 2025, only 6 of 11 Novembers finished green. Three of the last five were red. The best recent one was 2024, at about +37%.
4. 75.5%: the rate hike odds
The Fed raised rates by 25 basis points on Sep 16, to a range of 3.75% to 4.00%. As of Oct 26, Polymarket priced a 75.5% chance of another 25 basis point hike at the Dec 9 meeting, per Block Scholes. Higher rates are a headwind for risk assets, so this matters more than any chart pattern.
5. 2.8 points: the election premium
The US midterms are on Nov 3. Block Scholes found that $BTC options priced the election window only 2.8 volatility points above the next window, against 14.4 points before the 2024 vote. That reading is from Oct 26, so it predates the Oct 30 drop. The October jobs report follows on Friday, Nov 6 at 13:30 UTC.
One side note on ETFs
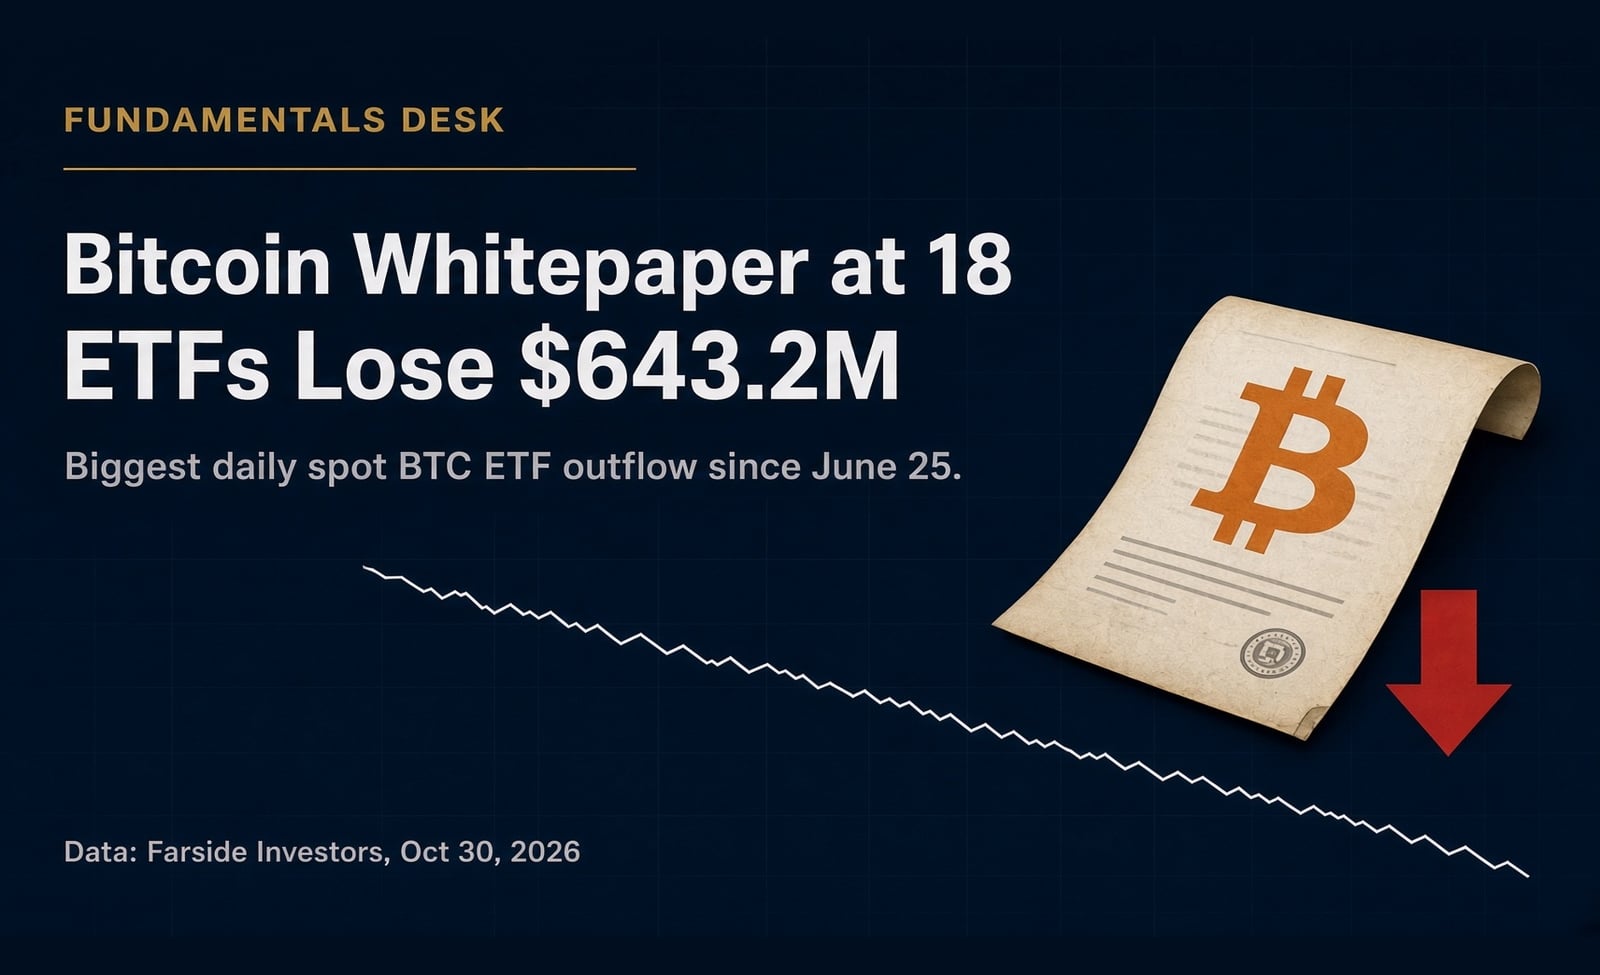
Farside shows US spot $BTC funds took in about $440.8M from Oct 26 to Oct 29, then lost $643.2M on Oct 30 alone. That is context, not the story.
My view
$BTC trades near $78,000 on Nov 1, about 38% below its $126,080 record. I watch two levels: the Oct 30 low near $76,100 and the $80,000 round number. Holding the first and reclaiming the second would fit a November recovery. Losing the first would match the 2018 and 2025 pattern. History here is thin, and rates and the jobs report can overrule it.
This is my opinion only. It is not financial advice. NFA.
Sources
- CoinGlass, "Bitcoin (BTC) Monthly Returns & Historical Returns" (read Nov 1, 2026)
- CryptoPotato, "'Uptober' Flopped as BTC Tanked 7%: Will November Be Any Different?" (Nov 1, 2026)
- Coinbase Exchange, "BTC-USD daily candles, Dec 2014 to Nov 1, 2026" (read Nov 1, 2026)
- Block Scholes, "Rate Hikes, Midterms and Prediction Markets" (Oct 27, 2026)
- U.S. Bureau of Labor Statistics, "Schedule of Releases for the Employment Situation" (read Nov 1, 2026)
- SorooshX, "Week Ahead: US Midterms, BoE and NFP, November 2026 (2 to 6 Nov)" (Oct 28, 2026)
- Farside Investors, "Bitcoin ETF Flow (US$m)" (data as of Nov 1, 2026)
- CoinGecko, "Bitcoin Price: BTC/USD Live Price Chart" (read Nov 1, 2026)