The first thing a trader does is open a chart. That chart has to be set to a trading timeframe, the length of time each candle covers. The best timeframe for trading is not a magic setting. It is the one that matches how long you can hold, and how much time you can spend on the screen. This report explains trading timeframes, compares scalping vs day trading vs swing trading and long term holding, and shows how to decode a chart from the higher timeframe down.
Key takeaways
- A trading timeframe is the length of each candle on the chart. Pick it to match how long you plan to stay in the trade.
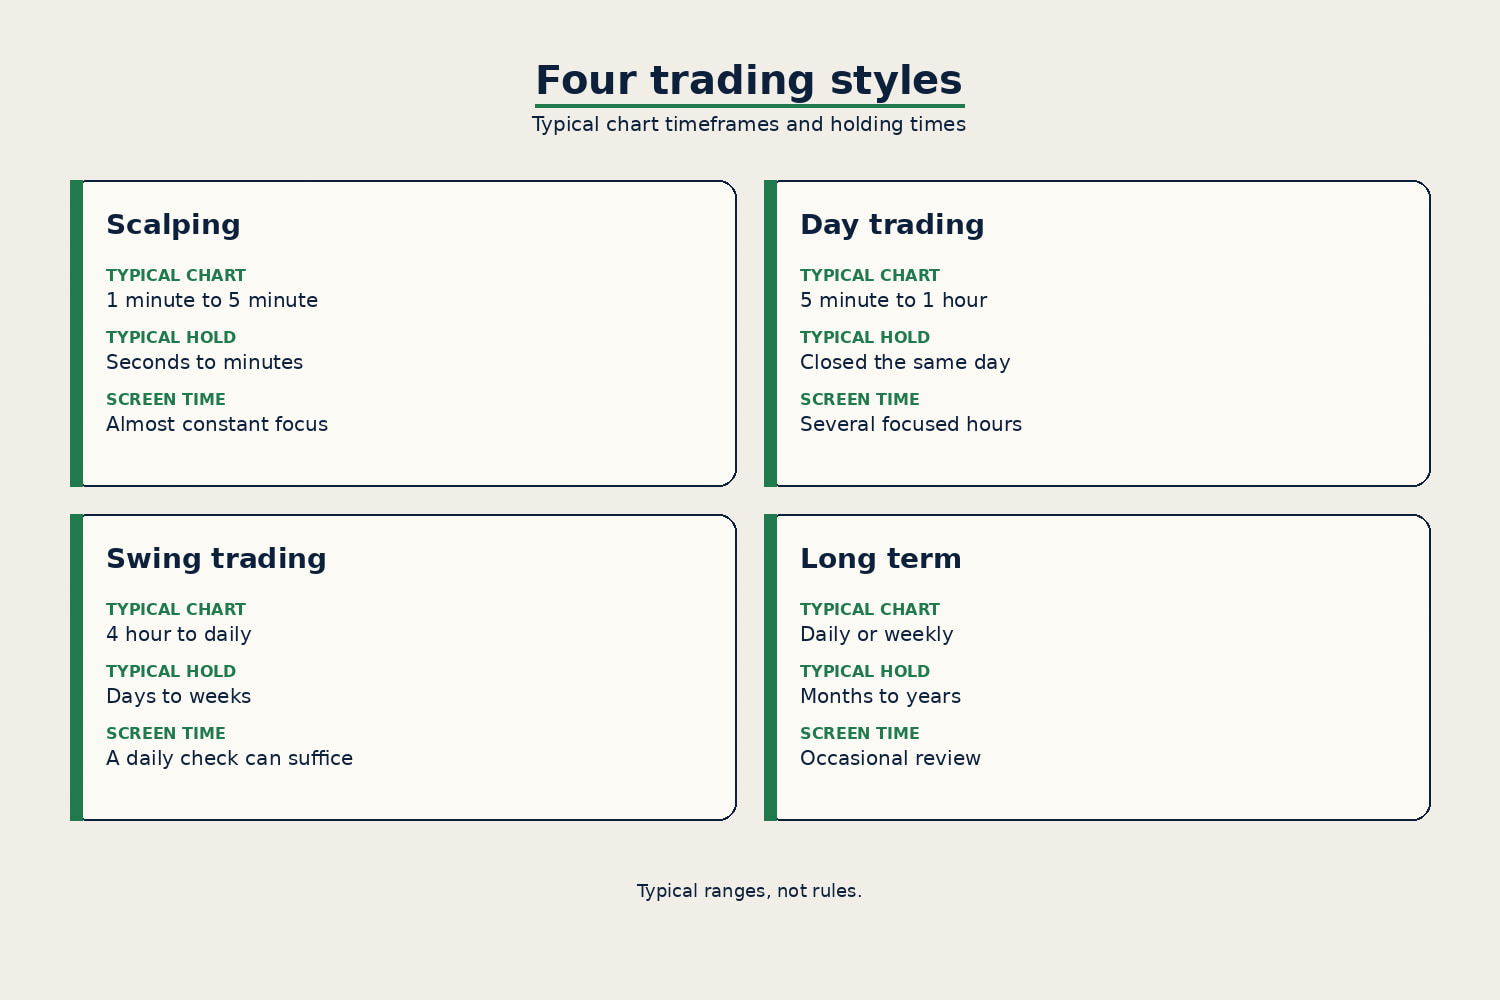
- Typical ranges, not rules: scalping, 1 minute to 5 minute charts, seconds to minutes; day trading, 5 minute to 1 hour charts, closed the same day; swing trading, 4 hour to daily charts, days to weeks; long term, daily or weekly charts, months to years.
- Start from the higher timeframe to read direction, then use a lower timeframe only to time the entry.
- Price can show three background trends at once: a primary trend, a secondary trend, and a minor trend. Each is easier to see on a different timeframe.
- A style that needs all-day focus will not fit a trader who can only check the chart twice a day.
From my desk
After several years in the markets, I avoid very low timeframes. For me, scalping is for professionals, especially in a market as volatile as crypto.
I favour the 4 hour and daily charts, with weekly levels, for swing trading. The goal is to avoid market noise. With Ichimoku as my base, I see the main trend at a glance, then adapt to the key levels. You can see it in my daily analyses.
What are trading timeframes?
A trading timeframe is the clock on the candle. If the chart is set to 15 minutes, each candle records the open, high, low, and close for those 15 minutes. If it is set to one day, each candle records a full day.
The same market can look calm on a weekly chart and chaotic on a 1 minute chart. Neither view is more true: the weekly chart tells you the background, and the 1 minute chart tells you what just happened in a very short slice. If the clock is wrong for the trade you have in mind, the swings and the sense of trend will be wrong with it.
Crypto markets trade around the clock, so a day on a crypto chart is a 24 hour slice. Open and close on a candle are simply the first and last prices of that slice.
What is the best timeframe for trading: scalping vs day trading vs swing trading?
There is no single best timeframe for trading. The useful question is which timeframe fits which trader: how long you hold, and how much attention you can give the screen. The ranges below are typical practice, not laws.
Scalping. Typical charts: 1 minute to 5 minute. Typical holding time: seconds to minutes. This style needs almost constant focus. Costs matter more here, because many small trades can give a large share of each move back to fees and slippage. It is a demanding style, not a default first setting.
Day trading, also called intraday trading. Typical charts: 5 minute to 1 hour. Typical holding time: minutes to hours, with the position closed the same day. In crypto, where the market does not close overnight, that usually means you are flat at the end of your own session. The U.S. Securities and Exchange Commission (SEC) describes day trading as extremely risky, and warns that losses can be large. The Financial Industry Regulatory Authority (FINRA), in its day-trading risk disclosure for U.S. securities accounts, also says a person should be prepared to lose all the money used for it. Those U.S. securities margin rules may not apply on a crypto venue, but the warning still stands.
Swing trading. Typical charts: 4 hour to daily. Typical holding time: days to weeks. You can often review the chart once or twice a day. The trade-off is overnight and weekend risk: price can move a long way while you are away from the screen.
Long term. Typical charts: daily and weekly. Typical holding time: months to years. This is sometimes called position trading when it is still an active trade with an exit plan. The work is to stay with a primary trend.
The difference is holding time, screen time, costs, and whether you accept moves that happen while you are offline. A person with a full-time job and two short windows in the day is usually better served by a swing or long term chart than by a 1 minute scalping chart.
The U.S. Commodity Futures Trading Commission (CFTC) cautions that virtual currencies are more volatile than traditional fiat currencies, that cash market price swings can be sharp, and that losses on margined futures can be amplified. If you trade under a funded program, the timeframe still has to fit the rules, especially any daily loss cap. See the funded trader programs report.
How do you decode a chart from the higher timeframe down?
To decode a chart is to know what one candle is telling you, then to read the higher timeframe before the lower one. Each candle records one slice of time: the body shows the open and the close, and the wicks show the high and the low. On a 1 minute chart, one candle is one minute. On a 4 hour chart, one candle is four hours. On a daily chart, one candle is one day. The same burst of buying can look huge on the 1 minute chart and small on the daily chart.
Start at the top. Open a higher timeframe first and name the background: an uptrend (higher highs and higher lows), a downtrend (lower highs and lower lows), or a range (price moving between two areas without a clear new trend). Mark the obvious swings, then drop to a lower timeframe only to time an entry in that same direction.
The lower chart is for timing, not for a new story. If the daily chart is falling, a sharp 15 minute rally is often a bounce inside that fall, until the daily structure itself changes. A burst on a 5 minute chart does not rewrite a weekly trend by itself. As an illustration, not a live trade and not a result: in a market that trades 24 hours a day, one daily candle covers the same period as six 4 hour candles, or twenty-four 1 hour candles. If you only watch the 15 minute chart, you can miss that the daily candle is still a down day. Use two or three charts, not ten: a higher chart for direction, and a lower chart for timing.
For further reading on one widely taught chart method, see the Ichimoku notes on the Learn page.
What are the three main background trends, and how do they map to timeframes?
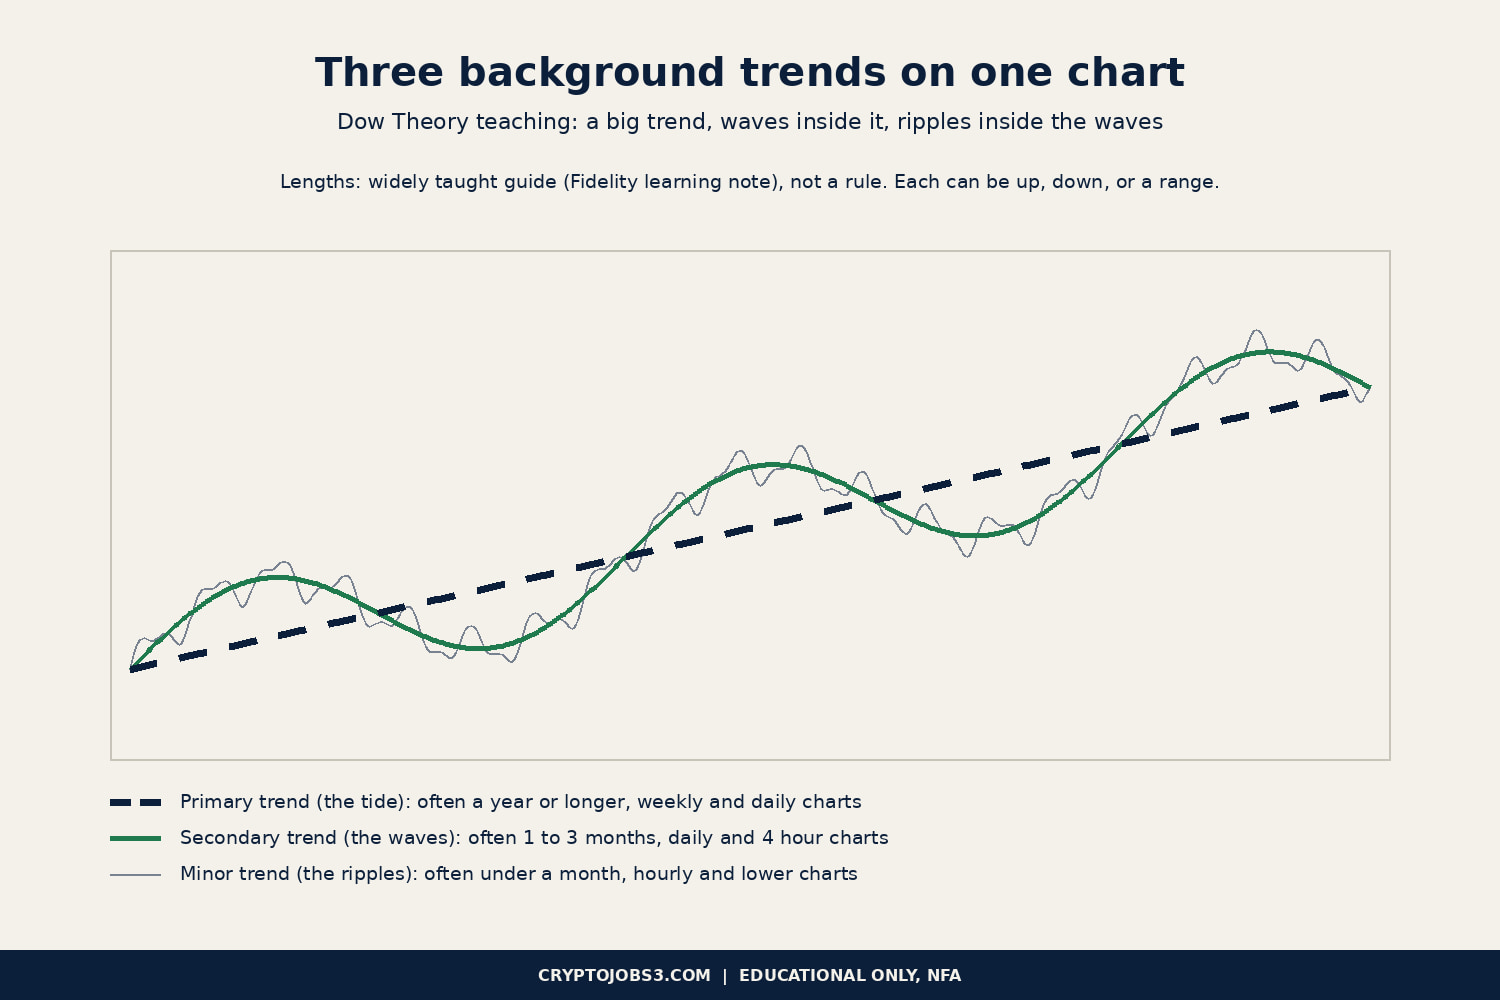
Markets can trend in more than one speed at once. The framework later called Dow Theory, after Charles Dow, describes three background trends that can run together. A Fidelity learning note on trend restates the usual teaching as follows:
- The primary trend is the long term tide, often a year or longer.
- The secondary trend is the intermediate wave, often around one to three months.
- The minor trend is the short term ripple, often less than a month.
Treat those lengths as a widely taught guide, not a law. Dow was writing about stock averages, and crypto can move faster. The useful idea is the stack: a large trend, a correction or rally inside it, and smaller ripples inside that. The three degrees map to trading timeframes as a typical read, not a rule.
- The primary trend is usually clearer on the weekly or daily chart, and is the background for long term work.
- The secondary trend often shows up on the daily or 4 hour chart, and is the usual background for a swing trade.
- The minor trend lives on the hourly and lower charts, and is what day trading and scalping are often dealing with.
Each of those can be an uptrend, a downtrend, or, for a stretch, a range. A primary uptrend can contain a secondary pullback, and that pullback can contain minor rallies. Name the degree first, then the direction, so a two hour bounce is not mistaken for a new primary trend.
Who is behind each trend: short term traders, long term holders, or big players?
Each trend degree is easier to connect to a holding period than to a named type of trader. The chart does not show who placed the orders.
- The minor trend, the ripples on hourly and lower charts, is the usual background for short term styles such as scalping and day trading, which typically hold for minutes to hours.
- The secondary trend, the waves on 4 hour and daily charts, is the usual background for swing trades, which typically hold for days to weeks.
- The primary trend, the tide on daily and weekly charts, is the usual background for long term work, which typically holds for months to years.
Volume is the amount traded during each candle. A Fidelity note on volume restates a usual teaching of technical analysis: to confirm a trend, volume should increase in the direction of that trend. A rise on high volume is read as stronger than the same rise on low volume, and the same goes for a fall. The note adds that moves on low volume may be said to lack conviction. Volume is a clue, not proof, and on crypto it can differ from one exchange to another.
What timeframe mistakes should you avoid?
- Opening the lowest chart first and building a story from noise.
- Using a scalping chart when you can only check the market twice a day.
- Cutting a swing or long term idea because of one weak hour, or forcing a day trade to last all week.
- Ignoring fees and slippage on a low timeframe, where many small trades can give costs a large share of the move.
- Treating a minor ripple as a change in the primary trend.
- Searching for one best timeframe that will work on every market and every week.
Checklist before you trade:
- I can name the style I am using today: scalping, day trading, swing trading, or long term.
- The chart timeframe matches that holding period.
- I have already read the higher timeframe for direction.
- I am not using a lower timeframe to argue against the higher-timeframe trend.
- I can say whether the move is a primary, secondary, or minor trend.
- If I am day trading, I have a plan to be flat at the end of my session, and I accept that this style is high risk.
FAQ
What is the best timeframe for trading?
There is no single best timeframe for trading. Trading timeframes should match how long you hold and how much screen time you have. Typical starting points are 1 minute to 5 minute charts for scalping, 5 minute to 1 hour for day trading, 4 hour to daily for swing trading, and daily or weekly for long term work. Those are common ranges, not rules. Read the higher timeframe first in every case.
What is scalping vs day trading vs swing trading?
Scalping aims at very small moves and usually holds for seconds to minutes. Day trading, or intraday trading, opens and closes within the same day, or within your own session in a 24 hour market. Swing trading holds for days to weeks. Long term work holds for months to years and stays with the primary trend. The differences are holding time, screen time, costs, and overnight risk, not a special indicator.
Should I start on a low timeframe or a high one?
Start on a higher timeframe so you can see the background with less noise, then drop to a lower timeframe only to time the trade. If you are new, a 4 hour or daily chart is often easier to learn on than a 1 minute chart. That is a learning preference, not a performance claim.
Do the three Dow trends appear on every chart?
The three degrees can run at the same time, but you will not always see a clean pattern on every asset and every week. Sometimes the market is simply in a range. Name the largest trend you can see, then the move inside it, then the small ripples. If the map is unclear, stand aside.
Follow live results
You can follow trades on Bitunix copy trading (Affiliate). Live results are on the site. This is not a claim about returns or about how often trades work.
See the live Bitunix copy trading results
Sources
- SEC Investor.gov, Day Trading
- SEC Investor.gov, Margin Rules for Day Trading
- FINRA Rule 2270, Day-Trading Risk Disclosure Statement
- CFTC advisory on the risks of virtual currency trading
- Fidelity, Basic concepts of trend
- Fidelity, Why to consider stock volume
Educational only, NFA.